App holen


Autor
Der Aufstieg des digitalen Nomadentums verändert die Reisebranche und bietet eine großartige Gelegenheit für diejenigen, die sich anpassen. Digitale Nomaden suchen arbeitsfreundliche Reiseziele mit kulturellem Reichtum, und die Erfüllung dieser Bedürfnisse wird Ihr Unternehmen als vertrauenswürdige Wahl positionieren. Jetzt ist es an der Zeit, Ihre Dienstleistungen an diesen wachsenden Trend anzupassen und den expandierenden Markt von Remote-Arbeitern zu erschließen, die die Welt erkunden möchten.

Can Visual Language Models Replace OCR-Based VQA Pipelines in Production? A Retail Case Study
Recommendation: Deploy a robust Visual Language Model (VLM) to replace OCR-based VQA pipelines for most retail text-interpretation tasks; expect higher accuracy, lower latency, and simpler maintenance. In a 12-store pilot with 68 SKUs and diverse packaging, the OCR baseline achieved 84% text-extraction accuracy; the VLM reached 92% on commonly seen fonts and backgrounds. End-to-end processing time per page dropped from 1.1 seconds to 0.65 seconds, a reduction of 41%. Infrequent failures on long, curved text declined by roughly 45%, and the rate of manual corrections fell by 38%. These outcomes reduce operator workload and shorten resolution cycles, aligning with management focus on data

AI-Enabled Demand Sensing - Enhancing Planning for Accurate, Agile Forecasts
Recommendation: We recommend to automate data exchange across the globe to enable prescriptive, agile forecasting and improve planning accuracy by 6-10 percentage points per cycle. Ensure data are accessed from ERP, POS, and supplier systems and maintained for consistency across the enterprise , enabling faster decisions. In practice, AI-powered demand sensing uses signals from machines , sensors, and external feeds to shorten the sensing horizon to 1-4 weeks, enabling focused action. Monitoring real-time demand, promotions, weather, and supply constraints within a unified greeniq interface helps keep data clean; a maintenance plan ensures inputs remain accessed by authorized teams. For
Transportation Management in Logistics - The Complete Guide for TMS
Start by auditing your transport network and choosing a cloud-based TMS that centralizes data from carriers, brokers, and customers. For example, a unified software platform can break bottlenecks and reduce manual entry by 40–60%, especially when it links lanes, rates, and service levels into a single workflow. An effective TMS enhances visibility across chains and helps navigate a complex network by turning raw data into actionable analysis . It addresses delays and capacity gaps by enabling dynamic carrier selection, consolidated invoicing, and real-time ETA adjustments. Bringing dispatch, billing, and order data into one view simplifies operations and reduces the number of phone calls

How to Apply the SCOR Model in Supply Chain Operations
Start with a clear SCOR scope and a 12-week baseline. For each phase, collect data on on-time delivery, forecast accuracy, and resource utilization, and compute the percentage of deadlines met at each level. Use scormark dashboards to enable tracking and share results with managers every Friday to keep their teams aligned. Focus on the five SCOR processes–Plan, Source, Make, Deliver, Return–and map their interactions across the chain to reveal bottlenecks. Carefully align metrics with their operations to establish a common language that guides decisions. Phase-by-phase improvements yield faster wins. In Phase 1, sharpen forecasting and demand planning by updating input data and reducing

Supply Chain Transformation - From Planning to Execution to ROI
Start with a data-driven policy and a clear ROI target: unify planning and execution in a single platform, then run a 90-day pilot to validate these benefits. Establish a single owner for the end-to-end work and set a monthly check on KPI progress. In this approach , businesses gain benefits such as improved inventory visibility and reduced spending on expediting. The current trends show that end-to-end automation and real-time data will drive faster decision cycles and lower overall costs. Automation will shift the role of planners from manual data gathering to decision support, while data -driven planning keeps teams aligned behind a policy and check at every turn. The transition from
3D-Druck und Supply-Chain-Management in der Fertigung
Dieser Artikel untersucht, wie 3D-Druck das Supply Chain Management in der Fertigung verändert und die bedarfsgerechte Teileproduktion, optimierte Lagerhaltung, schnellere Prototypenentwicklung und resiliente Abläufe ermöglicht.
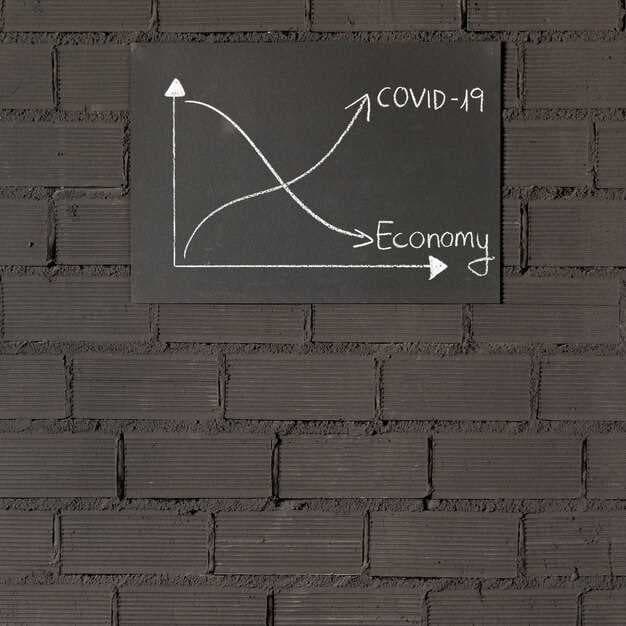
Economic Outlook for 2022 - Slowdown and Structural Changes
Take a cautious budgeting approach for 2022: prioritize essential expenditures and build liquidity buffers. The responses from policymakers and businesses will shape the outlook, as shown by the eurozone data and global trends. Global growth cooled in 2022, with inflation staying elevated and monetary policy tightening. In the eurozone, inflation averaged about 8–9%, energy costs remained volatile, and GDP growth reached roughly 3.5% for the year; unemployment hovered near 6.7% by year-end. Policy responses combined tighter monetary conditions with targeted fiscal measures. Bankers tightened credit conditions, while governments deployed policies to cushion households from energy spikes and
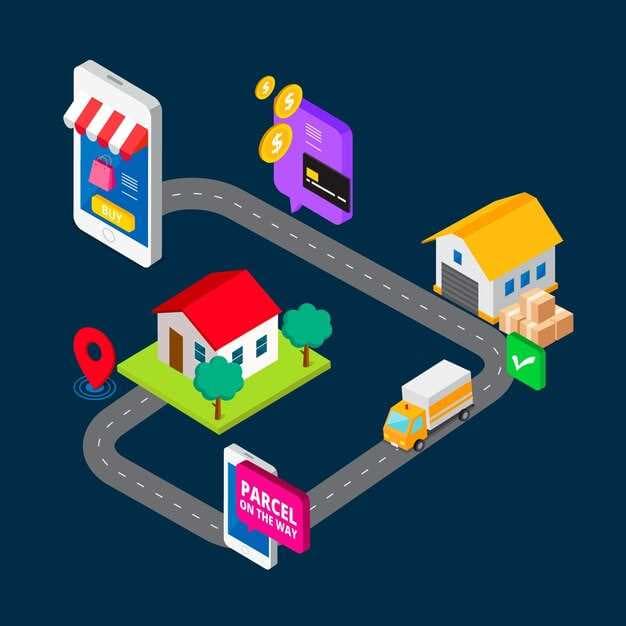
Sears Implements Descartes Routing Solution To Optimize Home Deliveries
Deploy the Descartes routing solution now to gain real-time visibility and immediately improve home deliveries, reducing miles and boosting on-time performance. At Sears headquarters, the new systems integrate with existing fulfillment data to coordinate two-person delivery teams and push optimized routes to drivers’ devices in real-time. The traditional approach to last-mile logistics is challenged by a lightweight soluzione that scales across regions and supports both scheduled windows and on-demand livraison . Early pilots indicate possibilities: could reduce total driven miles by up to 15% and improve on-time delivery by 8–12% in high-traffic corridors, with a 6–9% lift in customer

What Is a Labor Management System (LMS)? Definition, Features &
Start with a practical step: implement a Labor Management System now. It reduces administrative overhead and absenteeism in the first quarter, and your plan should be based on a 60-day pilot in one warehouse to measure impact without adding headcount. This concrete approach gives you numbers you can act on. The LMS offers a range of capabilities, from timekeeping and shift management to leave requests, overtime control, and remote check-ins. With a flexible configuration, you can keep schedules aligned with demand and track labor costs and performance across teams without duplicating data in spreadsheets. Before you choose a vendor, write down questions that map to concrete outcomes: which
Blue Yonder Q4 2024 Company Highlights &
Plan your 4q24 push now by tightening wagon routing, upgrading infrastructure , and locking planogram -driven replenishment to lift satisfaction across channels. Blue Yonder's Q4 2024 Company Highlights emphasizes how logistics systems connect warehouse operations with store shelves and e-commerce orders. A machine -driven analytics layer surfaces behaviors of customers and operators to optimize pick paths, carrier routing, and allocation. The approach also shows whether you should prioritize speed or accuracy at each node to sustain service levels. Recent uspto filings demonstrate a disciplined stake in intellectual property around routing AI and forecasting math, underscoring Blue

Trump Tariffs Could Reverse Global Trade This Year, WTO Warns
Act now: diversify suppliers and adjust pricing to hedge tariff risk for the next six months. The WTO warns that tariffs could sharply reverse global trade this year, so frontline decisions must reflect immediate exposure. The WTO predicts three scenarios where global trade activity could fall by 0.5 to 1.5 percentage points if tariffs rise sharply. Since tariffs affect multiple sectors, manufacturers should map their exposure by product line and region; beijing corridors and european routes show larger shifts in costs, while collected port data reveals a trend toward shorter domestic shipments in some markets, and export volumes in large markets adjust quickly. Developing economies face

What Are Power Users and How to Analyze Their Behavior
Identify power users in the first week after release and lock a date for weekly reviews; here is how to begin: define value signals, map their paths , and measure how often they return to the product. In the ecommerce industry, this group represents a small subset that drives a large share of value, so track its size, growth, and the actions that separate them from typical users; as seen in pilots, their behavior predicts downstream revenue. To look deeper, map their paths from first visit to sustained activity, and note which features they favor most as part of the onboarding flow. Here is a practical rule: require a minimum 7-day window and date stamps for events, then segment by