

 Deepwater Horizon Oil Spill – Causes, Impacts, and Environmental Lessons">

Since the Deepwater Horizon incident began on April 20, 2010, investigators flagged a blowout at the Macondo well after a failed cement barrier and a malfunctioning blowout preventer. The event released about 4.9 million barrels of oil over 87 days, reaching Λουιζιάνα shorelines and affecting offshore habitats along the Gulf. Current data and modeling showed the plume traveling with prevailing currents, underscoring the need for real-time assessments of the leak location and volume.
The root causes combined equipment failures, management decisions, and regulatory gaps. Investigations identified a hole in the cement barrier, a failed pipe system in the well, and delays in activating the blowout preventer. The result was a massive emission of oil and dispersants into the water column, with roughly 1.8 million gallons of chemical dispersants released in the Gulf as responders tried to contain the slick.
Environmental and economic impacts unfolded quickly. The spill harmed marshes and seabirds, damaged fisheries, and disrupted tourism along the coast. The court process moved forward with penalties and funds directed toward civil restoration, totaling about $20 billion in penalties and settlements to resolve federal and state claims. These funds support habitat recovery, wildlife rehabilitation, and compensation for fishing communities.
Lessons for policy and industry emphasize stronger well design and cementing practices, more reliable equipment, and independent oversight. Agencies should adopt dynamic mapping and data-sharing practices, and responders must maintain rapid ανταπόκριση capacity to reach affected areas. In coastal states such as Λουιζιάνα, restoration programs should prioritize marsh recovery and the resilience of striped mullet and other key species, with dedicated funds to support long-term monitoring and community recovery.
By aligning safety, science, and accountability, we can reduce the risk of a similar event and accelerate ecological and economic recovery across the Gulf.
Root causes: cementing failures and blowout preventer (BOP) malfunction
Action: Implement independent cementing quality audits, and reinforce BOP testing protocols with real-time verification and third-party assessments. This approach targets the two dominant root causes in the Deepwater Horizon failure: cementing that did not establish a reliable barrier and a BOP that did not respond as designed under extreme well pressures.
Although the cementing job proceeded under pressure, the design and execution left a compromised barrier. The cement slurry design, displacement timing, and cement integrity verification were insufficient, allowing hydrocarbons to migrate up the wellbore toward the riser. Since the initial kick, months of escalating risk and spreading slicks affected gulf waters and louisianas ecosystems; the consequences extended beyond fisheries to every coastal community relying on clean, productive waters, and the development of nearby habitats.
On the BOP side, three linked issues typically explain the malfunction: control lines blasted by the explosion, internal hydraulic leaks, and jammed rams due to damaged pipe geometry. This compromised ability to seal produced a delayed response that allowed hydrocarbons to reach the surface, spreading across the surface and into deeper waters, with oil potentially swimming through channeling paths and compromising multiple cases of wildlife. The result was a prolonged blowout that highlighted gaps in maintenance, testing, and rapid decision-making during crisis conditions.
Implementation priorities for prevention and response
Set objectives that emphasize cement integrity, BOP reliability, and rapid, coordinated response. Establish three concrete actions: independent assessment of cementing materials, verification through cement bond log data, and full BOP functional testing before proceeding with any new well operations. Build a monthly assessment cycle to reach clear milestones, and publish results to foster accountability among operators, regulators, and impacted communities. This approach supports louisianas communities and ecosystems, helps rescue efforts when disasters occur, and strengthens action beyond the well site to protect every connected sector and stakeholder.
Spill dynamics: rate, trajectory, surface slicks, and underwater plumes
Recommendation: Maintain an interactive dashboard that tracks the wellhead rate, surface slick extent, and underwater plumes with daily data feeds and transparent methods for estimation.
Initially, the rate at the source rose quickly as the blowout progressed. Estimates ranged from a few thousand barrels per day to tens of thousands, with analyses determining a peak near 50–60 thousand barrels per day. This increased rate, coupled with sustained flow over many days, drove the final volume upward to about 4.9 million barrels released over roughly 87 days. The foundation for these figures rests on wellhead pressures, riser data, tracer tests, and cross-checks with satellite signals, creating a robust basis for communicating the amount to communities and stakeholders.
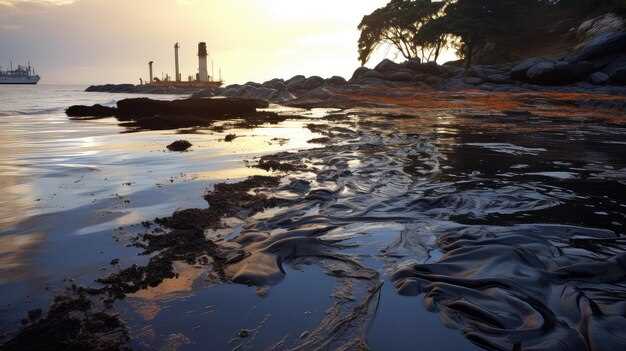
Trajectory and spread: Currents, winds, and deep-sea flows steered the plume along a shifting path. Surface slicks formed a moving sheet that tracked toward Louisiana and Mississippi coasts at first, then curved with shelf currents and the looping Loop Current. By combining satellite imagery, drift models, and in-situ observations, scientists mapped a series of locations where exposure risk appeared across multiple places and times. This trajectory information supported field teams and community leaders as they adjusted fishing schedules and safety advisories in response to changing conditions.
Surface slicks: Slick extent and persistence varied with sea state. In calmer conditions, sheets stretched tens of kilometers; in rough seas, fragmentation and mixing reduced coherence. Surface measurements showed increased coverage in some bays, with lingering residues that influenced feeding grounds and shorelines. Turtles and other wildlife frequenting near nesting and foraging habitats faced elevated exposure risk during peak slick periods, guiding targeted monitoring and protective actions by the community and field crews.
Underwater plumes: Subsurface plumes formed as oil droplets and dissolved hydrocarbons moved through the water column. Upward transport occurred as vertical mixing carried contaminants toward shallower layers, creating multiple plume locations at depth and along transport routes. Dispersants and natural buoyancy shaped plume morphology, affecting how dissolved, toxic components spread through the midwater and toward the surface. Field teams sampled at several depths to quantify the amount of contaminants and to assess threats to marine life, including turtles and demersal species, across different locations and days.
- Questions to guide monitoring include: how does the rate trend at the wellhead influence response capacity, and which locations show the highest surface slicks?
- What is the best way to interpret upward transport in plumes and to protect fishing areas and community livelihoods?
- Which multiple lines of evidence best constrain the final estimates of total release, and how should field teams adjust actions as conditions change?
- How do toxic components affect vulnerable habitats, and what adaptive steps improve resilience in the years after the blowout?
Ecological and wildlife impacts: birds, marine life, wetlands, and fisheries
Limit dispersant use to cases with clear net benefit to wildlife and fisheries, and implement a rapid, field-ready sampling protocol to verify outcomes. The process should include baseline samples and follow-up checks to track cetaceans, harbor seals, seabirds, and key fish species. An early collaboration reduces long-term damage and costs, and defines the order of actions for responders.
Birds face oiling that impairs buoyancy, feather integrity, and thermoregulation, leading to reduced foraging ability and higher mortality risk. Cetaceans, including harbor porpoises and other species, experience exposure through contaminated water and prey, with the spill actually altering physiological stress and feeding behavior; some died as a result. To understand impacts, teams should collect samples from affected birds and mammals and compare them to clean-site controls.
Coastal wetlands and marshes suffered sediment loading and shifts in microbial communities, altering plant productivity and habitat structure largely used by juvenile fish and foraging shorebirds. Restoration plans should develop a reserve-focused approach that prioritizes salt marsh complexes, seagrass beds, and shallow estuarine zones, with adaptive management built into every phase of the process.
Fisheries endured disruptions to harvest cycles and market access, altering stock dynamics and livelihoods. Monitoring programs that include water and tissue samples support risk assessments and recovery planning, helping managers adjust quotas and gear rules more quickly. Massachusetts communities demonstrate how local partnerships can support monitoring, data sharing, and restoration, benefiting long-term stock resilience and coastal employment.
Collaboration among agencies, researchers, and fishers established monitoring systems and data-sharing networks, initiating a disciplined workflow that informs response actions. The approach emphasizes developing clear protocols, evaluating dispersant effectiveness, and revising practices as new samples and results arrive. Disasters like this sprawl into broader lessons: robust collaboration, transparent reporting, and continuous improvement strengthen both conservation goals and fisheries support networks.
Cleanup strategies in practice: containment, skimming, dispersants, and monitoring
Begin with immediate containment and rapid skimming to limit surface spread. Install booms along the slick edge, deploy vacuum skimmers, and start debris collection within hours, shortly after the initial response begins. Keep a copy of the field protocol designed for rapid deployment to ensure consistency across teams. Track rates of capture and re-suspension to adapt tactics on the fly. Use square kilometers as a standard metric and share results with staff, contractors, and local stakeholders to sustain transparency and interest across programs.
Containment and skimming in practice
Deploy booms around the perimeter and anchor them to fixed holdings or docks to withstand weather shifts. Operate a fleet of skimmers with trained staff; rotate crews to reduce fatigue. Use interactive dashboards to track debris removal, oil films, and time-stamped data cards. Run a rapid assessment after tide cycles and adjust actions as measurements reached target levels; capture comments from field staff and others. In habitats such as marshes, estuaries, and coastal lagoons, minimize disturbance to wildlife; monitor dolphins and other marine life and shift equipment as needed. Use sponge sorbents to supplement booms in shallow bays. Monitor shoreline zones for eroded patches on a square meter grid and direct resources to high-priority areas. Collaboration with smithsonians adds datasets and external validation that strengthens the response.
Dispersants and monitoring: data-driven decisions
Apply dispersants only under predefined thresholds after an assessment that weighs ecological trade-offs. Track effectiveness through analysis and incorporate findings into the ongoing assessment framework. Use boats, drones, and sensors to sample water columns; observe dolphins, sponge habitats, and other indicators to gauge impact. Maintain a transparent record with comments from staff and partners; publish datasets for broad review. Collaborate with researchers, including smithsonians, to compare results with others and adjust use if threats to sensitive habitats emerge. Ensure monitoring covers dispersed oil fate, sediment dynamics, and changes in benthic communities; map erosion and recovery on a square grid, and update response cards accordingly. Through collaboration and open data practices, align cleanup actions with public interest and policy needs.
Policy reforms and industry accountability: offshore safety, liability, and oversight
Adopt a mandatory independent offshore safety audit regime with annual, publicly released results and a capped liability framework that ensures operators fund restoration promptly. Audits conducted by accredited third parties with on-site verification and transparent scoring will drive concrete improvements, then inform regulator updates and industry practice–and reduce spill risk, protecting your seafood and coastal livelihoods.
Institute a standard incident reporting condition form that requires immediate notification within 24 hours and uses machine-readable data to enable cross-agency integration. This approach creates a consistent baseline for response planning and measurable performance across operators, which supports concerned communities and markets that rely on clean coastlines.
Establish a single chain of accountability from on-site supervisor to the safety officer with clear safety objectives to minimize emissions, spills, and ecological damage and prevent operations going down. This structure guarantees timely escalation, documented decisions, and consequences aligned with performance and safety culture.
Just announced guidelines require operators to deploy booms rapidly, limit oils spread, and safeguard deep-sea habitats and protected species such as harbor seal and bottlenose dolphins. Rapid containment and targeted protection minimize ecological disruption while safeguarding coastal economies and recreational access.
Link daily operations to ecological and economic outcomes by an integration plan that aligns risk management with collaborations among fisheries, recreational users, researchers, and local authorities. These efforts protect habitats while preserving your seafood supply and keeping communities engaged and informed about progress and trade-offs.
Publish an encyclopaedia of best practices drawn from lessons learned from past incidents, with clear comments invited from industry, regulators, scientists, and communities. This living resource guides inspections, training, and response readiness, while enabling rapid updates as conditions change and new data emerge.
Integrated governance pillars
Integrating auditing, liability, and data sharing creates a cohesive governance system that reduces latency between detection and action. The pillars–safety performance, financial accountability, wildlife protection, and stakeholder engagement–support steady improvements and measurable results across sectors that rely on predictable offshore activity.
| Reform area | Μηχανισμός | Expected outcome |
|---|---|---|
| Offshore safety audits | Independent third-party reviews; annual public reports; capped liability | Lower spill probability; faster remediation; increased public trust |
| Incident reporting and data | Condition form; 24-hour reporting; machine-readable data; cross-agency integration | Faster containment; better situational awareness; reduced secondary impacts |
| Wildlife and habitats protection | Integrated wildlife response plans; safeguarding deep-sea habitats; protection for harbor seal and bottlenose dolphin | Minimized harm to wildlife; preserved biodiversity |
| Community and market safeguards | Public comments; transparent communications; financial assurances | Stability for seafood supply and recreational sectors; sustained coastal economies |