

 9 keskeistä trendiä, jotka muokkaavat viimeisen kilometrin toimituksia vuonna 2025">

Prioritize real-time visibility across the chain and empower consignees with flexible pick-up options to cut dwell time by up to 20% in dense urban zones. This move boosts access and customer satisfaction because it translates into reliable windows and fewer missed handoffs. Build this on cooperative networks (co-op) of local couriers, leverage crowdsourcing for surge capacity, and deploy bike couriers for urban micro-fulfillment, ensuring parcels reach the right hands without detours.
Extend automation to the final leg with drone and locker strategies since the economics of doorstep handoffs are sensitive to weight and distance. Lightweight parcels can fly from micro-hubs to local carriers, while locker networks improve access for consignees. This approach isnt just about speed; it blends reliability and access for urban residents, and harmonizes with amazons provider platforms to keep parcels moving, while empowering pickup with multi-access points that reduce dwell time.
Prioritize a customer-centric approach with end-to-end visibility and flexible hand-off options to cut friction across the chain. Use real-time data to optimize routes, offer access to pick-up points, and enable co-op networks to reduce empty miles. Since visibility is a backbone, invest in APIs that feed consignees with status signals and extended hours at pickup points to avoid fatigue.
Scale eco-friendly micro-fulfillment using bike teams and crowdsourcing to trim carbon footprint and improve speed in dense cores. Lock in access to multiple pick-up options, including staffed kiosks and co-op warehouses, to reduce failed handoffs. Real-time visibility across the chain helps consignees decide when and where to collect, boosting asiakaslähtöinen metrics.
Build resilient, partner-friendly parcel ecosystems by aligning nine providers in a co-op to share capacity during peak periods, and by enabling crowdsourcing from neighborhood fleets. Track performance with simple metrics: dwell time reductions, pickup-rate improvements, and on-time arrivals. Since visibility is the backbone, invest in API-driven integrations with amazons provider platforms and integrate status alerts to keep consignees informed.
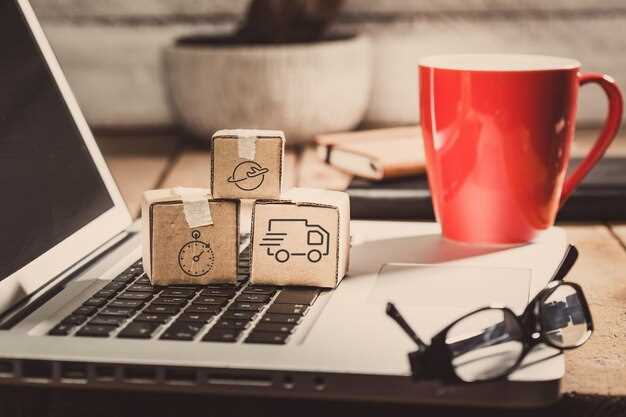
Last-Mile Delivery Trends 2025: Precision-Driven Sustainability
Start a 12-week ai-powered routing pilot in a single metropolitan area to demonstrate faster deliveries and lower emissions. Build a transparency program with clients and carriers, sharing real-time visibility into ETAs, route choices, and congestion indicators. If results show a 12-18% reduction in miles and a 6-10% improvement in on-time performance, scale the approach to adjacent areas within the network.
- Transparency-first data culture and practices: publish real-time status, ETA accuracy, and associated emissions per route segment; provide dashboards to clients and carriers to drive accountability and continuous improvement.
- ai-powered optimization: dynamic routing, dispatch, and load consolidation reduce miles by 12-18% and increase on-time deliveries by 8-15%; monitor variance and adjust models weekly.
- Urban micro-fulfillment and zone-based staging: testing in dense area clusters yields 10-20% faster deliveries; roll out to 3-4 additional zones within the next quarter.
- Reverse logistics acceleration: streamlined returns processing lowers reverse flows by 25% and cuts reverse-cycle time, reducing waste and improving asset utilization.
- Carrier-client collaboration: API-led visibility across networks enables near-real-time route adjustment and better capacity matching; use channels like twitter to share updates here while protecting data privacy.
- Sustainability metrics and reporting: measure energy intensity per shipment, carbon per delivery, and waste reductions; target 15-25% lower footprint by year end through efficient packaging and route optimization.
- Governance and scale: increasingly formalized playbooks, following KPIs, and governance to support rapid expansion across regions while ensuring compliance and data security.
Urban Micro-Fulfillment Centers: Site Selection, Capital Expenditure, and Throughput Targets
Choosing urban micro-fulfillment centers within 2–4 miles of dense demand corridors around major neighborhoods minimizes routes and accelerates fast orders.
Site selection should prioritize compact warehouse footprints with easy access for curbside pickup and dock operations, while proximity to population centers improves throughput. Use demand patterns to place high-turn inventory near loading bays and slower inventory in reserve zones to maintain accuracy and transparency.
Capital expenditure should allocate to modular automation and scalable sorting, with a focus on inventory control technologies and optimization of picking routes to improve accuracy and offering speed.
Throughput targets must be data-grounded: define initial orders per hour per square meter, time per pick, and peak capacity to plan staffing, routes, and batch sizes. Predict demand using patterns and adjust windows for shipments; maintain transparency with WMS and carrier feeds to track inventory and progress toward targets.
Growth hinges on choosing the right product mix, technologies, and partner solutions that sustain throughput, increase accuracy, and extend offering around micro-fulfillment.
Real-Time Routing with AI: Data Inputs, Toolsets, and SLA Alignment
Recommendation: Deploy an AI-driven routing module that recalculates paths every 45-60 seconds using live information from telematics, traffic feeds, weather, incidents, and order windows; tie decisions to SLA levels with explicit metrics for on-time status and path stability.
Here are concrete inputs, toolsets, and terms to address in the implementation.
- Order-level data: size, priority, time windows, customer location
- Vehicle and crew status: location, capacity, next task
- Live feeds: traffic speed, incidents, weather, road closures
- Environmental context: load types, hazardous materials constraints, restrictions
- Historical patterns: recent patterns, typical congestion times
- Chain-level constraints: handoffs, depot routing rules
- Service commitments: status of each pickup window
- Shared data: data pools with partners and warehouses to improve visibility
- AI routing engine: cost model blending distance, time, reliability, and SLA penalties
- Event-driven data pipelines: stream processing to ingest live feeds with low latency
- Edge compute: on-device inference where network is flaky
- Constraint programming or metaheuristics: multi-stop routing with real-time adjustments
- APIs and adapters: data sharing with partners and carriers
- Observability stack: tracing, metrics, dashboards to monitor latency and accuracy
- Latency bands: instant updates under 2 seconds for critical legs; fast updates under 15 seconds for others
- KPIs: route adherence rate, on-time status, dwell time at hubs, exact time-to-fulfillment estimates
- Data freshness targets: keep traffic and incident data within a 30-second window
- Fallback rules: if data is stale beyond threshold, switch to trusted default routes with risk-adjusted costs
- Human-in-the-loop: escalate to planners when confidence drops below a set level
- Auditability: log decisions with inputs that drove them, referenced in a whitepaper
Implementation pointers
- Start with a controlled case in a single region, measure faster routing gains and incident response reductions
- Unify data sources into a shared schema to simplify integration and reduce excess data transfer
- Use a tiered SLA model (gold, silver, bronze) to reflect different customer commitments and network conditions
- Publish exact time-to-fulfillment estimates to customers and carriers to increase confidence
- Regularly refresh the cost model with recent results and feedback from the chain partners
References
- Whitepaper sections covering data inputs, toolsets, and SLA alignment principles
- Case examples showing reductions in wait times and improved status visibility
Lockers and Contactless Hubs: Implementation Checklist and Operator Roles
Implement a phased pilot with 3–5 locker clusters and contactless hubs. Target accuracy above 99.5% for scan-to-collection events and complete validation within 8 weeks to justify a broader roll-out. Track failed pickup events, hold times, and waste caused by reattempts to quantify the gain before scaling.
Site design and tech integration: select locations with high visibility and sustained access, near transit nodes or commercial corridors. Deploy locker units with robust readers, camera-backed access, and codes issued via a smartphone app. Integrate with your order-management system so each parcel triggers an automatic code release and status post to your brand’s app. Ensure packaging fits locker dimensions and weight limits, then run a 2-week fit test with typical parcel mixes.
Operator roles and responsibilities: establish a clear structure–operations lead, field technician, security, and customer-support liaison. Theyre responsible for routine maintenance, locker restocks, and incident handling, while your fleet and post-ride teams synchronize handoffs. Use an armanious approach to governance, documenting decisions and updating playbooks after each shift or event.
Process design and customer experience: implement a simple retrieval flow: customer receives a unique code, submits it at the locker, and confirms pickup with a final biometric or PIN if supported. For failed attempts, provide a fast fallback option (within 2 minutes) and a secure offline option to avoid waste. Look for robust SLAs on code invalidations and post-pickup confirmation to protect your brand.
Sustainability and packaging: prioritize eco-friendly packaging choices that reduce weight and space, aiming to lower waste tied to handoffs. Favor lockers that minimize car trips by consolidating parcels for the same neighborhood, and monitor waste metrics monthly to drive continuous improvements in packaging and loading practices.
Security and risk management: implement tamper-evident seals, immutable audit logs, and geofenced alerts on after-hours access. Regularly review access patterns to detect anomalies, and schedule quarterly maintenance windows to prevent failed hardware events that disrupt most retrievals.
Data, metrics, and governance: track accuracy, failed-retrieval rate, average time-to-release, and peak-load periods. Publish weekly look at throughput by location and by locker type to inform scale decisions. Use most of these insights to inform maintenance cycles, driver routing, and restocking plans, ensuring a steady growth trajectory.
Long-term scaling and brand alignment: standardize locker aesthetics, secure-locking mechanisms, and user-flow across sites to preserve your brand look. Align locker procurement with traditional storefronts or hubs, and test new models in small markets before broader expansion. Ensure technology updates maintain compatibility with older devices and evolving packaging formats to sustain growth without disruption.
Cargo Bikes and E-Bikes in Dense Urban Areas: Deployment, Routing, and Safety
Recommendation: Establish a streamlined micro-hub network for cargo bikes and e-bikes in dense corridors. Begin with three pilot zones around major transit interchanges and high-density shopping streets, deploying 30–50 bikes per zone and 8–12 curbside locations. Use modular cargo boxes, shared charging, and a transparent app to track pickups and deliveries from pickup to drop-off, reducing dependence on heavier vans and freeing space around key locations. Incorporate weather-aware planning to keep service stable during rain or heat.
Deployment framework: Currently, prioritize zones with the highest demand and the fewest feasible alternate options. Target fewer but faster trips by consolidation of orders bound for the same block, which cuts vehicle movements and lowers emissions. Recent pilots show a 40–60% reduction in truck trips in central pockets and a drop in waste streams for grocers and retailers. Weather-resilient gear and around-the-clock maintenance are non-negotiable to keep a steady cadence. Amazons and other clients expect on-time windows and transparent status updates.
Routing and capabilities: Use a demand-capture engine that pulls from clients and the app, with routing options that consolidate multiple locations in a single run. Plan around weather, time windows, and traffic; incorporate drone-assisted checks for street closures and robot-assisted docking at hubs. The option to combine small parcels into a single route boosts throughput while reducing total stops; publish transparent ETA and capacity data to partners to align expectations.
Safety and risk management: Implement speed limits up to 25 km/h, helmet use, high-visibility gear, and lane separation where available. Equip cargo mounts with secure straps and anti-tip hardware; require drivers to perform pre-shift checks; choose loading procedures that balance weight and center of gravity. Regular training, signage near schools and crossings, and real-time alerts help keep clients and pedestrians safer as fleets operate around busy streets.
| Aspect | Approach | Vaikutus |
|---|---|---|
| Fleet scale | 3 pilot zones, 30–50 bikes each | space-efficient, lowers truck trips |
| Payload range | 60–120 kg per cargo box | flexibility for a variety of parcels |
| Toimitusnopeus | 12–22% faster per stop | improves service levels |
| Truck reliance | 40–60% fewer trips | reduces traffic and emissions |
| Safety metrics | strong training and equipment | lower incident rate |
Sustainability Metrics for Last-Mile: Emissions, Packaging, and Carrier Collaboration
Baseline emissions and packaging metrics must be established immediately, with a target to cut emissions per parcel by 15% and curb excessive packaging by 10% within 12–18 months. Here is how to begin: this requires cross-functional data sharing among retailers, carriers, and logistics teams. Actively set up a joint dashboard to track CO2e per parcel, packaging weight per order, and recovery rates at every location.
Emissions metrics: Track kg CO2e per parcel by mode, and monitor route carbon intensity by location. Recent pilots show that actively consolidated routes via optimized local hubs can reduce final-mile emissions 20–35% versus ad hoc dispatch. To stay competitive, retailers are looking to develop a standard emissions dashboard and follow science-based reduction targets for sustainable outcomes across locations. Efficiency gains come from optimizing mode mix, shared transport, and micro-fulfillment.
Packaging metrics: measure average packaging weight per order, excess packaging rate, and share of recycled content across materials. Target reductions: 15–25% excess packaging and 30% recycled content in plastics and paper. Adopt standard packaging guidelines to minimize damage and returns while preserving product protection. Implement packaging rules to ensure compatibility with carrier handling, reducing waste and optimizing space in vehicles. When choosing packaging options, prioritize lightweight, recyclable materials to cut excess while keeping product protection intact.
Carrier collaboration: Build a three-tier collaboration model: data-sharing agreements with top five partners; joint route optimization and load consolidation pilots; and co-investments in micro-fulfillment and sustainable packaging practices. Track metrics such as on-time percentages, average miles per parcel, and the share of shipments with multimodal legs. This joint approach helps reduce excess miles, improves product flow, and strengthens green credentials with banks and other investors.
Execution plan: map locations by proximity to demand, pilot with 3–5 carriers in 4–6 locations, implement a shared KPI suite, align on packaging guidelines across retailers, and report quarterly to executives and lenders focusing on efficiency and carbon metrics. This approach supports competition by showing clear capabilities and reduces legacy inefficiencies while keeping the focus on sustainable growth.