


Recommendation: implement a focused digital twin pilot to monitor real-time operations, run what-if scenarios, and mimic supplier and factory flows to validate improvements before a wider rollout, harnessing the power of simulation to reveal bottlenecks.
In research across manufacturing and logistics use cases, the approach delivers significant, actionable insights that help reduce cycle times, improve on-time delivery, and ensure alignment between planning and execution during processing, aligning with stakeholder interest across teams.
To balance innovation with risk, define strategies that create data governance, calibrations, and risk-mitigation controls, while enabling rapid experiment cycles that reveal where the model diverges from reality, while maintaining clear accountability.
Using real-time streams from ERP, WMS, and transport partners, the digital twin increases companys visibility, supports decision-making for day-to-day operations during disruptions, and provides a shared reference for cross-functional teams.
During creation of the model, prioritize monitoring of key processing steps, set clear success metrics, and schedule regular reviews; this keeps stakeholders engaged and reduces risks through proactive adjustment.
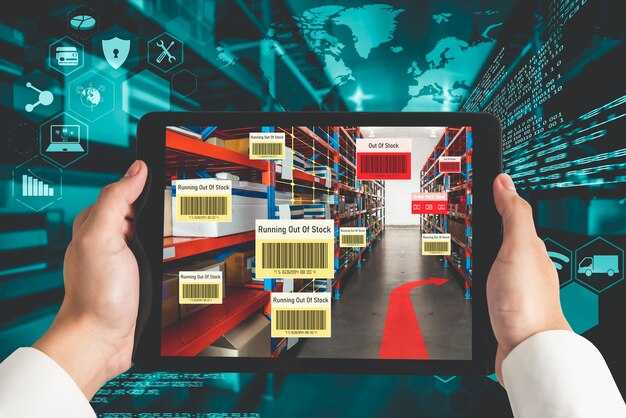
Digital Twins for Visible and Agile Supply Chains: Key Components of Digital Twin Technology
Start by launching a full digital twin of the most critical processes–inventory, orders, and distribution–to create visible, actionable insight across the world and a tower of data driving decisions. By april, establish a baseline and a timeframe for scaling. Use a virtual model that mirrors real-life operations and connects to external systems (ERP, WMS, TMS, supplier portals) so the entire network stays synchronized.
Our architecture includes a unified data foundation drawn from internal systems and external feeds, a virtual model, a robust analytics engine, and an orchestration layer that links processes across the entire network. Skilled teams create and maintain the models, calibrate them with real-life data, and indicate changes that drive action. The approach should be test-driven, with clear gates to verify accuracy before broader deployment.
To operationalize, map data sources, standardize interfaces, and run controlled experiments that compare predicted outcomes with actual results. Focus on the bottom line: tangible improvements in cycle time, inventory accuracy, and service levels. Start with a number of pilot scenarios to learn what moves the needle, then expand the scope as models prove reliable and scalable across day-to-day decisions.
| Component | What it includes | Primary benefit | Key metrics |
|---|---|---|---|
| Data foundation | Internal systems plus external feeds, asset telemetry, and partner data | Clean, timely inputs for accurate simulations | Data quality score, latency, coverage (% of processes) |
| Virtual model | Physics-based and AI-driven representations of demand, supply, and logistics | Realistic scenario planning and forecastability | Forecast accuracy, calibration error, adoption rate |
| Analytics & scenario planning | What-if analysis, optimization, sensitivity checks | Actionable recommendations and risk-aware decisions | Number of scenarios tested, cycle-time reduction, savings potential |
| Orchestration & governance | APIs, data lineage, security, role-based access | Seamless integration and compliant operations | Automation rate, governance compliance, incident count |
Digital Twins for Visible and Agile Supply Chains

Start with a focused pilot: deploy digital twins for three critical supply chain lanes to gain enhanced visibility, tracking, and contingency insights. The twins will ingest real-world sensor data, ERP and TMS inputs to simulate thousands of demand, supply, and disruption scenarios, revealing where inventory, capacity, and lead times are impacted and where small changes yield outsized gains. This approach creates a repeatable pattern, creating value for managers who scale.
Structure data flows for near-real-time processing: streaming feeds from suppliers, plants, DCs, and carriers, integrated with ERP and planning systems. Use event-driven updates to refresh twin state every 5-15 minutes in high-velocity segments. Define what is needed for alerts, such as a 10% deviation in cycle time or a 5% SKU-level stockout risk. This keeps decisions timely and actionable. Usually, engineers and planners agree that data quality dictates twin value; often latency becomes the gating factor. Leverage advanced analytics on twin signals to sharpen forecasts.
From here, learn which constraints bind the network and which replenishment policies are robust. Engineering teams can address bottlenecks by altering network design, lead times, or sourcing mix within the twin environment before touching live operations. Offering scenario dashboards, the platform supports what-if analysis with real-world data, helping to prioritize actions. Addressing data quality at the source will improve twin reliability. Only clean, standardized data will yield reliable twin insights.
Examples of value: after a 90-day rollout, typical gains include reduced bullwhip, improved on-time delivery (OTD) by 12-22%, and a 15-25% reduction in expedited freight. Ships passing through the twin network can visually confirm path viability; thousands of potential routes are compared rapidly, and contingency plans are pre-built. Tracking across vast networks empowers managers to act quickly.
Practical steps to scale: start with a minimal viable model for a handful of SKUs, then expand to thousands as you validate data quality and governance. Create a governance layer, data lineage, and security controls. Address data quality by standardizing attributes and ensuring reproducible processing. Adopt open technology standards and modular components to avoid vendor lock-in.
Data integration across ERP, WMS, MES, and IoT
Implement a unified data fabric that connects ERP, WMS, MES, and IoT to generate real-time signals for core processes and enable informed decisions across the market.
- Define a common data model that captures key fields (order_id, item_id, quantity, location, status, timestamp, device_id) across ERP, WMS, MES, and IoT, enabling consistent reporting and detection of deviations.
- Build connectors and an event-driven layer to stream updates with latency targets under 500 ms for critical events, so personnel can act fast and optimise operations rather than wait for batch files.
- Institute data governance: validation rules, deduplication, lineage, access control, and metadata to trace impact on business processes and reduce risk to the field.
- Set up a real-time analytics and modeling layer to detect anomalies, forecast stockouts, and plan capacity across planes, warehouses, and transport nodes, delivering actionable insights for management and shop floors.
- Embed feedback loops where development teams and IT partner with operations teams to refine data models based on observed signals and market needs, improving innovation and the advantage for impacted companies.
This framework makes important decisions easier by aligning data across departments and levels of the organization.
The covid-19 period underscored that fast data integration reduces disruption by enabling cross-functional teams to respond to shifts in demand and supply, delivering resilience that markets reward.
- Latency target: < 500 ms for critical dashboards
- Data quality: accuracy > 98%; deduplication < 0.5%
- Real-time visibility: share of processes with live data above 75%
- Inventory cost: reduction goal of 8–15% year over year
- On-time shipments: improvement of 2–5 percentage points
- Detected events per day: scalable monitoring to support daily planning cycles
For business leaders, the advantage comes from turning disparate signals into an integrated picture, enabling informed action and faster development cycles while ensuring personnel have clear, actionable inputs to guide daily decisions.
Real-time data pipelines and event streaming
Implement a real-time data pipeline anchored by Apache Kafka or a cloud-native alternative, with change data capture from ERP, WMS, and MES systems to capture changes as they occur. This reduces the gap between event and action, improving visibility for decision-makers and making managing costs more predictable while preserving business interest. Start with core streams: orders, shipments, inventory levels, and sensor data from warehouse equipment to protect money while providing high-value insights about things that matter. That yields real visibility across processes and things.
Architect for reliability: idempotent producers, partitioned topics by domain, and schema validation. Enable exactly-once processing where feasible and add backpressure handling. Build a monitoring layer to detect lag, missed events, and schema drift, and set alerts for when counts of test events diverge. Run test cycles that simulate peak changes to validate end-to-end latency and fault tolerance, and to verify between upstream ingestion and downstream processing. Include a monitor to surface latency and event loss. This makes issue detection more likely.
Real-time streams deliver tangible gains across the industry field and warehouse operations. Operators see real inventory levels, transport planners adjust routes on demand, and production lines align with demand signals. By detecting anomalies early, you cut waste and avoid overstock. Provide dashboards tailored to different stakeholders, delivering actionable insights across warehouse teams, field staff, and management to act quickly. This supports sustainable operations and continuous improvement across things that matter.
Governance and metrics: define service-level indicators for the pipeline, track between stages, measure time-to-detect for anomalies, and compare alternatives such as managed services versus self-hosted streams. Quantify the impact on money saved from reduced stockouts and waste.
Training and research: invest in training for operators to read dashboards, run test scenarios, and act on alerts. Conduct field studies to validate models, explore different data sources, and capture learnings that inform processes across the industry.
Model fidelity: calibration, validation, and updates
Calibrate the core model against live shop-floor data every two weeks and bind updates to a fixed timeframe. Ground calibration in data-driven checks that pull from external sources, including supplier dashboards from multiple suppliers and factory sensor streams.
Choose metrics with clear business impact: RMSE for throughput, MAE for cycle time, and on-time delivery percentage. Track improvements as a percentage reduction in forecast error after each calibration cycle, targeting a significant 12-18% drop over a 3-cycle window.
Validation uses a holdout set: reserve 40% of historical data and test across product families and supplier types. Compare model outputs to actual outcomes from the Penfield factory and external sources; look for consistent bias reductions.
Update cadence: deploy automated updates every 14 days, with a rollback path if drift exceeds 5% in key KPIs.
Role of governance: assign a data steward to lock sources, track version history, and document changes to calibration logic.
Collaboration and data sharing: align definitions with manufacturers and suppliers, share validation results, and run joint tests on live plant data across the factory.
Professor-led review: a modeling team led by a professor conducts quarterly audits of calibration rules, checks for drift, and tests new data-driven adjustments before production.
Case notes: at Penfield, calibration improved forecast accuracy for line 3 by 18% after 2 cycles, reducing stockouts by 6% and excess inventory by 4%.
Scenario planning: what-if simulations for disruptions
Run weekly what-if simulations across the network to quantify impacts on service levels, total cost, and time-to-recovery when disruptions hit suppliers, carriers, or demand signals. Use prescriptive models to translate scenarios into concrete actions on inventory, production sequencing, and transport routes, and connect each scenario to a roadmap with optimization-based recommendations that protect commitments and enabling rapid recovery. Tie these actions to your strategy for resilience to ensure alignment with longer-term goals.
Identify disruption types across external shocks, internal constraints, and market shifts. Build a library of disruption scenarios with notes about propagation paths, including external shocks could affect across regions and modes. Each scenario feeds a set of models that quantify cost, service, and sustainability impact, enabling you to discover bottlenecks and the time needed to restore operations. Integrating data from suppliers, carriers, retailers, and IoT gateways lets you view impacts across functions and time. Tools for data collection, stress testing, and visualization empower people from planning, procurement, and operations to act together across the network.
To implement, map your network and define service targets; feed the models with current supplier data and external signals; tune prescriptive rules; handle trade-offs and assign owners; and maintain a living roadmap that updates with outcomes. Set triggers and decision rights for when to switch to alternative routes, adjust safety stock, or reallocate capacity. Even with imperfect data, run conservative assumptions to keep momentum and making progress toward the strategy.
Establish governance with a cross-functional team that meets regularly to review results, update models, and refine the roadmap. Track metrics that cover service level, time-to-decision, time-to-recovery, and sustainability indicators; compare planned versus actual outcomes; use the feedback to improve optimization rules and extend scenarios. This ongoing loop increases the value of scenario planning across systems and processes, making decision-making faster and more robust.
Dashboards, alerts, and actionable insights for operators
Deploy a live, connected dashboard suite that surfaces prescriptive alerts to operators on the warehouse floor and production lines, guiding immediate actions to reduce downtime and improve throughput. Tie signals to assets across production, processing, and storage so the operators see which equipment is impacted and why, with a clear path from observation to resolution and guidance for them.
This article outlines concrete steps to translate data into actions that matter at the bottom of operations, helping a company continuously enhance performance across sites.
- Signals and assets: Map every signal to the specific asset, whether a machine, a station in the warehouse, or a processing line, and display a tower‑style indicator that shows health, utilization, and throughput risk.
- Prescriptive alerts: Replace vague warnings with recommended actions, owner assignments, and time‑to‑action windows, so operators act without delay.
- Workflow integration: Link alerts to runbooks and control‑system commands, and allow a quick deploy of approved changes into live production or material handling paths.
- Metrics and visuals: Use per‑asset KPIs, line charts, and heatmaps to illuminate impacted areas, enabling drill‑down from the bottom‑line impact to root causes.
- Continuous improvement: Calibrate rules weekly as product mix and demand shift, and record outcomes to refine the nijs engine for future processing.
- Deployment path: Start with one site, then scale to a global footprint globally to capture signals from processing, production, and warehousing across the company.
- Real‑world examples: Document outcomes such as MTTR reductions, warehouse cycle‑time improvements, and reduced stoppages to demonstrate value.
- Identify data sources (MES, WMS, SCADA, ERP) and ensure connectivity to the dashboard.
- Define alert levels, escalation paths, and operator roles for each site.
- Configure prescriptive actions and automatic action deployment when safe to do so.
In this article, operators learn how to deploy such dashboards into live workflows and continuously monitor signals to optimize assets and process throughput, both locally and globally for your company.