


Specific discloser policy should accompany every stock movement through the store floor. Configure the platform so actions, timestamps, and item references are auditable, enabling quick reconciliation and tighter liabilities control during peak operations.
Divide the facility into practical places by function: receiving, put-away, picking, packing, dispatch. Define specific criteria governing item placement, and require staff to authenticate with passwords when using the platform. Ensure the needs of each zone are understood and that throughput aligns with realistic targets.
Set required checks at every step: receive into the correct store location, deliver to the packing area, and confirm with a supervisor. Maintain a discloser trail that can represent every action in the system, reducing missed steps and exceptions.
Equip the operation with key accessories such as RFID tags, handheld scanners, and label printers to support retrieval efficiently, minimize errors, and improve cycle times. Document the needs of each station and refresh tooling on a scheduled basis.
Protect data integrity through disciplined access, passwords rotation, and continuous monitoring. Ensure staff understood core policies so the platform can allow rapid corrections when issues appear. Cancel any task lacking prerequisites to avoid missed shipments and liabilities.
Practical strategies for modern warehouse inventory management

Adopt a unified stock-control platform with real-time feeds and implement a weekly cycle-count program to reach 99% actual accuracy. Ensure participating departments and suppliers align on shared metrics, with a year-long rollout and quarterly milestones.
Structure data around a defined number of units per item, amounts on hand, amounts in transit, and processed orders. Use a single source of truth and limit manual reconciliations to rare exceptions.
Apply modular designs for data models; publish offering templates to teams; coordinate with providers and professional services; use modules to support receiving, put-away, picking, and packing; attach videos from audits to confirm counts.
Define step-by-step procedures and map networks across facilities to minimize handoffs. Use visual process sections and cross-functional accountability.
Create collection-based catalogs; designate collection items by category; determine whether items require refrigeration or hazardous handling; set access controls.
Shipping performance: track dock-to-ship time, lead times, and resolution of discrepancies within 24 hours.
Select providers and implement a suite of modules covering receiving, put-away, picking, packing, and shipping.
Training includes videos and quick-reference guides; monitor whether accuracy improves by 1-3 percentage points yearly; adjust curricula accordingly.
Implementing a phased plan with milestones, training sessions, and a 30-day risk review keeps teams aligned.
KPIs focus on reducing shrinkage and improving fulfillment reliability: shrinkage below 0.2%, on-time ship rate above 98%, and cycle-count resolution above 97%.
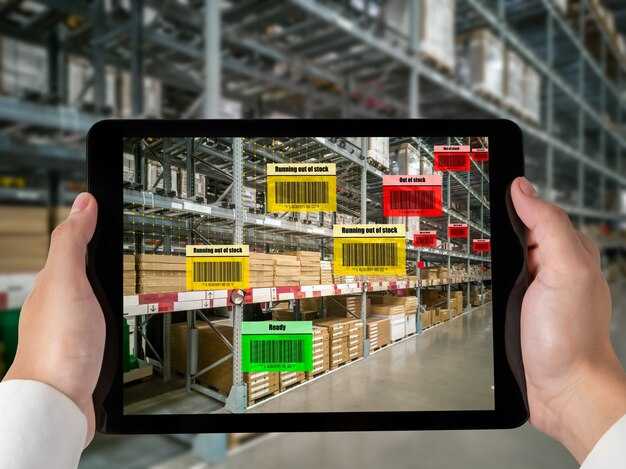
Real-time inventory visibility with RFID, barcode, and WMS integration
Implement RFID tagging on high-turn goods, pair with barcode captures at receiving, putaway, picking, packing, and shipping, and push updates into the WMS within 120 seconds. The required data fields populate automatically; use a barcode backup when RFID isn’t read, ensuring immediately chain visibility on movements from dock to dock.
RFID reduces manual checks, freeing time to focus on value-added tasks. Expect accuracy above 99.0% in real counts across multiple sites; tag costs vary: 0.10–0.25 USD each, amortized over 12–18 months. Incomplete scans trigger auto-recheck; clerical delays drop below 1% of cycles, boosting profits by low single digits historically.
Plan reserve locations for rush shipments; use color tags to indicate status such as cancelled, paid, or warranty-backed goods. A single document governs data integrity. Documented applications support domestic speed; accepts scans that would surface late entries or returns; remarketed items move to the active sale channel quickly; purchase and document statuses align in a single source, ensuring written records.
The program assumes responsibility from receipt to shipment, with stringent checks; conduct quarterly audits; supply chain partners participate in shared data models; written policy documents govern data handling; document links align with paid and purchase orders; warranty data attaches to goods so returns can be managed quickly; colors indicate status at each node in the chain, enabling quick exception handling.
Adopt a single, auditable program that accepts rush and routine orders alike; real-time counts reduce delta with cancelled or remarketed goods; overstock items get automatic replenishment; profits rise as write-offs shrink; colors and reports illustrate exception trends across the domestic chain; programs start with a written policy and a signed document, with warranties tracked to the item level; conduct reviews quarterly to maintain accuracy and compliance.
Robotics-assisted picking, packing, and replenishment workflows
Install a modular robotics stack across two automated zones–picking and replenishment–with a single orchestration server and standardized end-effectors. Start with 3–4 autonomous carriers per zone and monitor daily throughput, cycle time, and error rate to verify results within 60 days. Typical outputs include a 25–40% uplift in items fulfilled per shift and a 15–25% drop in mispicks when integrated with barcode scanning and dynamic slotting.
Robots move items from storage to packing modules, then trigger replenishment actions when stock dips below thresholds. The system distributes tasks among several units and those employees; dashboards on computers show real-time status. Users access a website for registration and scheduling, while a representative from the vendor coordinates integration. Daily alerts keep teams aware of faults via notice; returning items flow into refunds and credits channels through outletreturnshpcom; fulfilling orders updates values and credits after verification. Daily reconciliation ensures payable amounts stay accurate, and the entire cycle returns measurable results that link to customer satisfaction and cost reductions.
| Stage | Baseline cycle time | Target cycle time | Hatás |
|---|---|---|---|
| Picking | 120 s | 75 s | −38% |
| Csomagolás | 60 s | 40 s | −33% |
| Utánpótlás | 180 s | 120 s | −34% |
| Returns processing | 140 s | 95 s | −32% |
Options include cloud-managed orchestration with on-site robotics, a hybrid edge-cloud model, or standalone modules. Required prerequisites cover network readiness, security baselines, and staff training; registration of devices and user roles is mandatory. Costs are split between capital and operating expenditures, with payable installments aligning to project milestones. The website portal supports registration, access control, and issue tracking; acknowledge setup completion via a confirmation screen. Those responsible teams should coordinate with a representative to tailor task queues, align with needs, and ensure daily visibility across operations. The goal remains a smooth flow that translates to higher customer value and predictable refunds or credits where applicable.
Key notes: monitor daily metrics through a central dashboard; notice any deviation immediately and adjust slotting rules; several options exist to scale, including adding another picking cell or expanding replenishment threads. Those investments pay back through faster fulfillments, better accuracy, and improved employee engagement. Representatives should keep the outletreturnshpcom portal current to handle returning items, returns, and related credits with clarity, while teams acknowledge changes in process and update the registration records accordingly. Usability for users and those employees remains the core driver of sustained results and durable improvements.
5G-based Smart Factory pilots: latency, throughput, and edge compute on the floor
Deploy a compact 5G edge pod on the line to push end-to-end latency below 2 ms and sustain 3–5 Gbps of throughput per pod, enabling real-time control and autonomous actions on the floor. This setup hinges on URLLC-enabled radio, MEC on site, and tightly coordinated microservices that reduce cloud chatter, overhead, and backhaul costs. The result comes with a lean data path, higher reliability, and faster cycle times, therefore improving overall throughput while preserving quality.
- Architecture and targets: establish four edge nodes co-located with a gNB and a light analytics stack to keep collection latency tight. Aim at the fastest response in control loops, with regisztrált devices capped at 1,000 per pod and capacity headroom for peak shifts.
- Throughput and latency: expect capacity to scale to 10–20 Gbps aggregated across the floor, while per-device latency remains under 2 ms. Quality of service is validated by jitter < 0.5 ms and packet loss < 0.1% during peak hours.
- Edge compute role: run lightweight inference and stateful decision logic on the floor to support each picked item, reducing backhaul trips and enabling immediate corrective actions when anomalies arise.
- Telemetry and collection cadence: implement collection at 50–100 ms for critical loops and 1–5 s for non-critical health metrics, with frequent refreshes to keep dashboards current.
- Security and governance: apply zero-trust on the MEC layer, with encryption at rest and in motion, and submitted audit logs to a central repository. The discloser abrams notes a need to közread findings to stakeholders in a timely manner, and the partner kapadia confirms line-of-sight to compliance requirements.
- On-floor devices and readiness: ensure that sensors, PLCs, and cameras are regisztrált and capable of replacement if a node degrades, while keeping overhead minimal by local processing.
- Operational impact and ROI: projected profits rise as cycle time compresses and scrap drops; a typical pilot yields double-digit improvements in line output and a payback that comes quicker when scale expands. Operators can proceed with confidence after a published results deck.
- Human factors: technicians carry rugged phones to monitor edge health, receive alerts, and trigger on-the-spot adjustments without leaving the floor.
- Data governance: implement a collection policy that tags each datapoint with a timestamp and operator ID to support traceability, ezért enabling quick root-cause analysis when changes impact quality.
- Common pitfalls: avoid excessive on-site compute redundancy that adds overhead without proportional gains; favor modular microservices that can be optimized and retired in sequence as pilots mature.
- Step 1 – map coverage and demand: quantify sensor density, actuator count, and peak concurrency to determine capacity needs; establish baseline latency and throughput targets.
- Step 2 – deploy MEC pod and 5G spine: install on-floor edge nodes, configure URLLC lanes, and validate Rendben. QoS settings; document the network topology and published results.
- Step 3 – onboard devices: register sensors and actuators, assign IDs, and create a data model that supports collection events and event-driven actions; ensure the discloser Abrams can közread baseline metrics with a clear audit trail.
- Step 4 – run pilot use cases: implement real-time picking optimization and on-line quality checks; verify each workflow step returns within target latency and yields expected profits.
- Step 5 – monitor and adjust: track frequent KPIs, tune radio parameters, and adjust edge resource allocation to maintain capacity while minimizing overhead.
- Step 6 – publish outcomes and plan expansion: publish a concise results package, gather stakeholder feedback, and decide on broader adoption; the team should submit a growth plan that aligns with business goals and Rendben. governance.
Cycle counting, ABC analysis, and accuracy improvements
Implement a risk-weighted cycle-counting policy immediately: tag A-class stock as monthly, B-class quarterly, C-class semi-annually; align counts with electronic documentation; require reconciliation within 48 hours; establish a 24-hour window to send discrepancies to the merchant and logistics partner; utilize integration with the ERP so changes reflect instantly.
Classify items by value and velocity: A-class items drive the majority of dollar value while representing a minority of SKUs; C-class items dominate quantity yet carry low value; apply annual thresholds, maintain a consistent cadence, and monitor long-term accuracy drift to prevent incomplete postings; use these insights to adjust par levels and replenishment plans.
Improve accuracy through perpetual counting supported by electronic scanning, mobile devices, and routine validation against the source of truth; ensure each count is tracked, posted permanently, and integrated back into the master data; minimize manual entry to exceptions; measure labor hours per cycle and quantify the consequential impact on service levels to justify additional resources. This approach ensures consistency between physical stock and system records.
Handle merchant returns and reconditioned lots as distinct statuses; include them in the ABC framework, and reflect their movements in electronic documentation; capture claims, dispositions, and updated stock values; ensure cycles remain consistent when items are flagged incomplete or moved through refurbishment; maintain an auditable trail that supports traceability.
KPIs drive governance: target cycle-count accuracy by class (A 99%, B 97–98%, C 95%), discrepancy rate reduction, and year-over-year drift; track results with participant dashboards and share these metrics with sending teams and partners; include corrective actions, root-cause analysis, and training to sustain improvement; this approach uses data-driven decisions to guide actions and yields a clearer reflection of stock health.
Analytics-driven demand forecasting, safety stock, and replenishment planning
Adopt a 12-week rolling forecast linked to transit times and demand volatility; set a 95% service level on client-critical items and convert this into a dynamic safety stock policy that adapts during peak periods and supplier reliability changes.
Calculate safety stock using the formula: safety stock = z × σ_demand × sqrt(L), where z corresponds to the chosen service level, σ_demand reflects demand variability, and L is lead time in periods. Use transit time to refine L; if supplier lead time extends, increase z accordingly. This approach sustains supply during massive demand shocks, therefore reducing the risk of stockouts.
Implement a category-based replenishment scheme: A items trigger frequent orders, B items use time-phased replenishment, C items align with vendor-managed replenishment. Tie orders to transit windows; maintain a reserve for items with unreliable supplier performance. Content from forecasts goes into accounts, enabling proactive risk management and reducing disputes through transparency and acceptance of vendor commitments.
Discontinue obsolete items after a defined non-use window; capture proof from sales data to justify removal. Maintain proper documentation in content that supports disposition decisions; charge disposal costs to the correct accounts and report changes to stakeholders.
Strengthen relationships with suppliers by sharing forecast content; this governance, governed by policy, helps accepting commitments, reduce disputes, and deny erroneous allocations. If allocations change, disclose the rationale, and keep taxes and charges aligned with contracted terms in accounts. Acquisition plans should be reviewed carefully to maintain compliance and avoid invalid commitments.
Measure success by forecast accuracy, fill rate, transit adherence, and post-fulfillment checks. Use backtests to identify invalid forecasts and adjust models accordingly. Ensure the content remains accessible to client teams; if changes arise, communicate them promptly, maintaining proper traceability across accounts and charges, and documenting reasons for change as part of governance.