


Launch a 12-week pilot to test sharing spaces for warehousing in three urban corridors, tracking shipping speed, order accuracy, and returns handling against your current distribution network.
Invest in robust infrastructure with modular racking, real-time inventory visibility, and API-enabled integration to online orders, enabling a seamless omnichannel distribution and faster turns.
Adopt a long-term strategy that builds a bigger, distributed network of micro-fulfillment centers near customers, cutting long turn times and delivering consistent service across the chain.
Build partnerships to support navigating their needs, acknowledging limited space and the variability of returns, and align with trusted companys to cushion capacity swings across your logistics network.
Finally, map the distribution footprint, optimize shipping lanes for online orders, and establish clear KPIs to sustain performance and responsiveness as demand shifts.
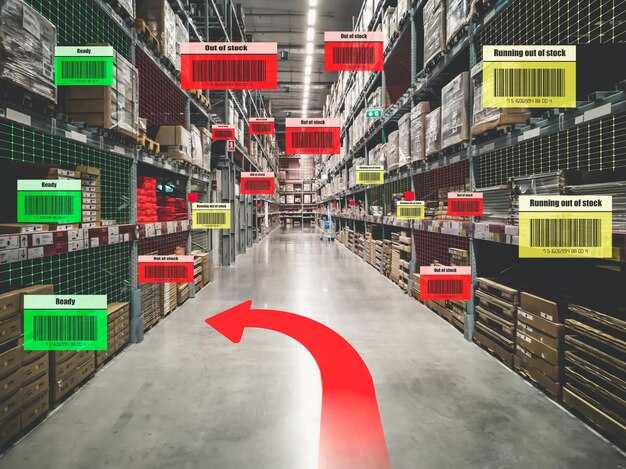
The Sharing Economy Disrupts Traditional Warehousing
Outsource non-core storage to third-party warehouses to ensure delivered, scalable capacity. This approach reduces capital risk, aligns cost with demand, and keeps inventory within reach of customers. It also frees your internal staff to focus on core capabilities like product fulfillment and customer experience.
The challenge is coordinating multiple locations, tracking units, and maintaining service levels as demand shifts. With online orders and variable demand signals, test different models for space, staffing, and transport to find what works best and how to scale efficiently.
Build a lean team to own partner negotiations, resource planning, and data-driven process improvement. Use custom SLAs to convert variability into value, keep routines predictable, and establish clear management dashboards. Look for long cost-efficient gains as you integrate third-party providers into a seamless workflow that preserves control over inventory and service quality.
Techtarget analyses show real-time tracking and cross-network visibility cut mismatch and dwell times, enabling operations to respond quickly to spikes in demand. Relying on online platforms to capture demand signals, you can coordinate resources across units and facilities, improving commercial performance and keeping service promises.
Most models rely on a mix of owned and non-owned space, robust inventory control, and continuous process optimization. Prioritize transparent tracking, clear communication with staff, and regular performance reviews to keep cost per unit low while maintaining service levels. By design, this approach lowers upfront capital needs and reduces risk by avoiding dependence on a single supplier, relying on a flexible network of third-party partners.
Sourcing On-Demand Warehouse Space via Platform Marketplaces
Begin with a 30-day pilot on a platform marketplace that offers on-demand warehouse space to validate fit. traditionally, warehousing tied teams to fixed leases and limited flexibility, often leading to delays and waste. platform marketplaces provide highly scalable options across warehouses, offering near-instant availability that reduces investment risk and presents an option to meet today’s needs without large upfront capital. This approach helps your business navigate growing demand for flexible storage and identify efficiency gains across your warehousing footprint.
A quick note about cost transparency helps you compare offers across marketplaces.
- Define needs: list products, forecast volumes, and required services (receiving, labeling, and kitting). Include any office space at the same place if you need a small office nearby to coordinate activity.
- Choose the right marketplace: look for coverage near key distribution channels, support for hybrid storage (rack and bulk), and demand-based pricing. Check for infrastructure-ready features such as WMS/API integration and inventory visibility.
- Benchmark cost and contracts: compare all‑in rates (storage, handling, inbound/outbound), and confirm cancellation terms. For growing business, expect a reduced overhead when shifting from fixed leases to on-demand warehousing.
- Test service levels: verify receiving windows, access control, inventory checks, and the ability to scale during peaks. Ensure SLA clarity for order processing and replenishment to avoid disruptions.
- Pilot and scale: start with 1–2 locations in proximity to customers, measure order lead times and throughput, and expand when targets are met consistently.
What to measure during the pilot? Track time-to-occupy, cost per unit of storage, throughput, and inventory accuracy. A tight feedback loop helps you compare traditional warehousing against on-demand options and shows where you gain efficiency. Focus on reduced dwell times, improved replenishment velocity, and better capacity to pause or scale storage as needed.
Risks are manageable with proper checks. Confirm insurance coverage, liability terms, and data security, especially when integrating with your ERP or WMS. Verify that the platform supports temperature controls if you handle sensitive products, and ensure compliance with regulatory requirements for your market. Clarify who handles inbound receiving, putaway, and outbound shipping during peak periods to avoid gaps in service.
In practice, sourcing on-demand warehouse space via platform marketplaces aligns with the needs of a growing business that aims to move away from rigid infrastructure. It reduces delays, waste, and capital investment while expanding warehousing options to meet disruptions. The moment you validate a few pilots, you gain a clearer view of how to optimize your warehousing footprint today and into the next season, while staying resilient and responsive to customer needs.
Dynamic Pricing Models and SLA Negotiation for Shared Warehousing
Set tiered dynamic pricing anchored to SLA outcomes and real-time visibility. Define three packages for shared warehousing spaces: Standard, Growth, and Priority. Tie price to time-to-fulfillment targets, capacity utilization, and risk of delays. For todays market, this approach lets customer teams pick services that fit their chain and scaling operations faster while preserving margins. Use insights from tracking data to adjust rates monthly and keep leasing competitive in both commercial and retail segments. This model must be supported by a clear SLA catalogue that spells credits and remedies.
When negotiating SLAs, anchor terms to measurable outcomes: on-time arrivals at the place, inventory accuracy, same-day processing, reliable tracking, and close space proximity. Extend pricing and SLA terms to other commercial use-cases that share warehousing. Establish credits at 2 percent per 1 percent SLA miss, capped at 20 percent of monthly leasing costs, to ensure accountability. Use a 30-, 60-, 90-day review cycle to adjust terms as demand shifts and network scales, resulting in improved risk management and smoother operations.
| Tier | Price per unit (monthly) | SLA on-time (percent) | トラッキング | 可視性 | Leasing term | 備考 |
|---|---|---|---|---|---|---|
| スタンダード | $0.75 | 95パーセント | ベーシック | 限定 | 12ヶ月 | Entry-level for small teams |
| 成長 | $1.15 | 98 パーセント | 強化 | 高い | 12–24 months | Better for rising demand |
| Priority | $1.60 | 99.5パーセント | 上級 | フル | 12ヶ月 | Same-day pick/pack near dock |
News from the field shows that customers favor packages with higher visibility and faster provisioning. The resulting offering unlocks bigger opportunities: more spaces, faster leasing cycles, and closer alignment with todays time horizons. Use dashboards to show units and percent utilization, so teams can forecast needs and negotiate renewals before the current term ends. The model supports collaboration across the supply chain and can be extended to adjacent office or commercial spaces where sharing reduces idle capacity.
Real-Time Inventory Visibility with APIs and Data Standards

Implement an API-first platform that links WMS, ERP, and TMS to expose real-time inventory visibility across multiple spaces and facilities. reading signals from robots, sensors, and handheld scanners feed a unified data layer, enabling continuous monitoring of goods as they move through warehousing and distribution steps.
Adopt common data standards such as GS1 for unit identifiers, EDI for supplier orders, and JSON/REST payloads for API exchanges. This universal language lets traders, suppliers, and carriers read the same data model, reducing misreads and enabling global coordination of stock movement. When data maps align, users can automate replenishment, cross-dock, and allocation decisions across the chain.
When data is consistent, you can expect a measurable impact: some warehouses see a 15-25% reduction in stockouts and a 10-20% cut in handling waste in the first year, as units travel from supplier to customer with fewer stops. This visibility also compresses cycle times across the supply chain.
edwin, a logistics analyst at a regional 3PL, demonstrates how API-driven alerts cut delays by 30% in peak seasons by flagging deviations in receiving and put-away steps. The insight comes from a global view that includes the performance of spaces, docks, and intra-warehouse movements.
Real-time visibility requires a practical, step-by-step integration. Start by connecting at the data layer to capture units as they enter spaces, then layer robotics and dock automation to accelerate put-away. Look for middleware that translates heterogeneous formats into the standardized schema, facilitating cross-organization sharing among suppliers and carriers.
The shift toward API-enabled visibility transforms resource planning from a static forecast to a living picture of availability. With global networks, you can extend reach to smaller suppliers over regional markets, observe inventory levels in near real-time, and align orders with transport capacity. In the future, dynamic allocations will merge warehousing, distribution, and transport into a single process that reduces waste and speeds the flow of goods.
The rise of modular spaces also helps look ahead. The rise of micro-warehousing extends reach into local markets, enabling a faster response to demand spikes and enabling a leaner process across the chain. Establish governance around data quality, define service-level expectations, and monitor KPIs such as fill rate, inventory accuracy, and cycle time to sustain the improvements over time.
Last-Mile Integration: Micro-Fulfillment Hubs in Urban Areas
Deploy 2–3 micro-fulfillment hubs within a busy urban corridor, placed near a prime place for customers. They cut last-mile distance and boost visibility of order status for customers. Each hub, 5,000–12,000 sq ft, should include automated picking zones, a packing area, and a returns dock to handle returns quickly. With this setup, scaling to additional sites around the city becomes feasible as todays demand expands, and the company can share inventory across chains for more reliability.
Efficiency data show in dense markets, micro-hubs can cut last-mile costs by 20–40% and speed deliveries from hours to minutes for a majority of orders. A typical hub handles 2,000–4,500 SKUs and maintains 8–12k pick slots; automation such as shuttle storage or compact racking can lift throughput from 1,200 to 3,000 lines per hour. At this moment, a two-hub model covers a large portion of daily demand, enabling faster service and easier distribution. If you want to dive into the data, start with a baseline and track last-mile distance weekly.
Operational models: use shared capacity across some operators to defray capex, while keeping a clear SLA and data-sharing with customers. Visibility dashboards show order status, inventory levels, and returns flow in real time. This approach fits with diverse chains and supports bigger retailers and smaller shops alike. They could adapt to seasonal peaks by shifting labor across hubs, helping the company stay flexible.
Implementation steps: map demand by zip codes to locate hubs near busy corridors; start with one pilot hub and test 4–6 weeks; expand to a second hub if capacity meets targets; integrate with amazon and other retailers’ fulfillment models; measure ROI with capex, operating costs, and incremental revenue from faster delivery. Whether to scale further depends on ROI, traffic, and customer feedback.
Scaling tips: keep a lean network, use modular automation, and run experiments with real-time data. Focus on visibility, faster restocking, and flexible staffing. todays demand patterns often favor a 2–3 hub network to cover the majority of city orders, with a bigger facility reserved for peak periods. Monitor customer feedback and adjust routes to optimize distribution.
Risk, Insurance, and Compliance in Shared Warehousing
Start by securing a COI with baseline limits: GL $2M per occurrence, cargo liability coverage $100k, BI $500k, and an umbrella of $5M. Name your companys as additional insured and ensure the coverage is primary and non-contributory. Align these limits with your inventory value, freight volume, and supply chain exposure to prevent gaps during peak shopping seasons.
Dont move forward without verifying the operator maintains OSHA-aligned safety programs, NFPA 101 readiness, and proper fire suppression. Require documented safety training, monthly drills, and a clean incident log. Ensure site access controls, CCTV surveillance, and perimeter security are integrated with your tracking system so you can verify throughput and respond quickly if a loss occurs. The warehouse should provide a WMS with real-time inventory tracking and batch-level traceability, with dashboards you can access for experience and oversight.
Step 1: Map exposure – classify goods by value, velocity, and handling needs. Step 2: Validate insurance and primary wording. Step 3: Inspect compliance documents – OSHA logs, fire-safety reports, and HazMat certifications if relevant. Step 4: Review data safeguards – access controls for digital assets, data transfer protocols, and privacy measures.
Data shows that programs with automated tracking and cage-free storage reduce mis-storage and shrink while speeding recalls. In audits across 50 tenants over 12 months, 62% required COI upgrades; tenants with verified coverage saw a 6–8% uplift in on-time delivery and a 12–18% drop in disputes. Proximity to markets also cut last-mile freight by 8–12% on average, supporting stronger margins across the supply chain.
To meet risk and lift profit, set a 60–90 day review cadence: document risk appetite, establish KPI targets (incident rate, inventory accuracy, on-time shipments, and COI status), and compare the cost of shared space against your existing footprint. If a metric dont meet target, renegotiate terms or switch providers. Share findings with other stakeholders to meet companys goals and improve access, efficiency, and overall experience.