

 56 Cargo Ships Stuck Off California Coast as Ports Hit Fourth Record Backlog in Three Weeks">

Podjąć natychmiastowe działania: wydać regionalny alert i realokować moce przerobowe w kierunku doków z dostępną przepustowością, aby zmniejszyć zator.
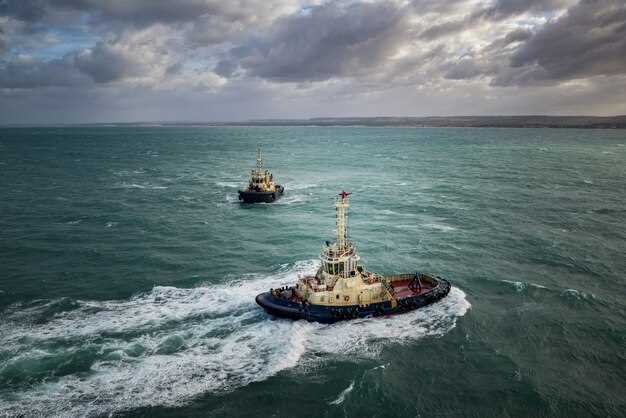
W najnowszym skanie, pięćdziesiąt sześć statków dryfuje w pobliżu wybrzeża Pacyfiku, w sąsiedztwie dużego miasta, z zakłóceniami, które osiągnęły rekordowy poziom, jeśli chodzi o czas oczekiwania w dokach i spowolnienie wymiany kontenerów i towarów.
Zalecane kroki dla władz i bezpośrednich przełożonych: priorytetowo traktujcie kolej i śródlądowe trasy krótkodystansowe do transportu pustych i załadowanych jednostek z zatłoczonych doków, wydłużajcie okna odbioru i ustalajcie progi zużycia jednostek chłodniczych, aby zapobiec niepotrzebnym podróżom, które mogłyby stać się problemem.
Ostatnie dane wskazują na szczytowe czasy postoju okrążające doki; informator o imieniu Pedro zauważa, że dalsze wydatki na infrastrukturę mogą złagodzić problem, ponieważ przepływy handlowe w regionie pozostają wysokie w przyszłości, a trasy wokół głównego miasta są pod presją.
Áine, starszy analityk w regionalnym stowarzyszeniu, postrzega to jako test zwinności operacyjnej: zakłócenia obciążają sieć dystrybucji, a jednocześnie ujawniają gen odporności w strategiach adaptacyjnych. Schemat ten jest widoczny w okresie świątecznym i powinien wywołać ostrożną, ale proaktywną reakcję ze strony zespołów ds. łańcucha dostaw.
Aby zminimalizować negatywne skutki, utrzymuj dzienny kanał powiadomień, udostępniaj standardowe metryki dokom i koordynuj działania z partnerami lądowymi, aby zapewnić płynność transportu i uniknąć przenoszenia problemów na pobliskie węzły komunikacyjne. Celem jest wymierna poprawa czasu realizacji kontenerów przy jednoczesnej ochronie wzmożonej aktywności handlowej w pobliskich korytarzach z dala od najbardziej zatłoczonych odcinków.
Praktyczny przewodnik po zatorach: kluczowe czynniki, dotknięte aktywa i kroki naprawcze
Rekomendacja: wdrożyć plan optymalizacji nabrzeża pięciostanowiskowego, działającego w trybie 24/7, aby zredukować zalew kontenerów, skrócić cykle placowe i zmniejszyć liczbę nierozwiązanych dostaw. Ustanowić priorytet dla sekwencji o wysokiej przepustowości i zarezerwować okna nabrzeżowe przed nadchodzącymi cyklami; dopasować korytarze lądowe, aby przemieszczać TEU w kierunku węzłów śródlądowych, minimalizując jednocześnie czas przebywania na terminalu.
Kluczowe czynniki: nawałnica kontenerów i gwałtowny wzrost popytu w połączeniu z dotychczasowymi wzorcami spowodowały przeciążenie sieci. Od około grudnia do lutego wolumeny gwałtownie wzrosły w związku z ożywieniem gospodarczym; udziały w tym miały źródła w Deyang; ta dynamika wymaga przekształcenia sieci przed kolejnym cyklem. Gwałtowny wzrost obciążył stanowiska, suwnice bramowe i sprzęt placowy, co spowodowało utratę przepustowości i zmniejszenie przepustowości przy bramach, rozprzestrzeniając nacisk na cały system. Aktualne dane i proaktywna koordynacja z spedytorami i partnerami krajowymi mają zasadnicze znaczenie dla zapobiegania powrotowi do stanu zatoru.
Dotknięte zasoby: miejsca postojowe i pasy bram terminali, suwnice bramowe, sprzęt placowy, pule podwozi, floty ciężarówek, kontenery, oświetlenie i składy paliw. Czasy przetrzymywania wzrosły, a kontenery gromadziły się w pobliżu punktów dostępu do stref przeładunkowych w pobliżu plaży w szczytowych momentach. Szybkie zwycięstwa obejmują optymalizację ruchów na placu, modernizację oświetlenia dla operacji nocnych oraz zapewnienie stałego dopływu energii i paliwa, aby utrzymać płynność operacji oświetleniowych.
Kroki naprawcze:
1) Zaplanuj strategię całodobowych okien postojowych w pięciu terminalach, aby przyspieszyć przybywanie statków i skrócić czas przestoju przed spodziewanymi okresami wzmożonego ruchu. 2) Scentralizuj komunikację za pomocą jednego pulpitu skrzynki odbiorczej i zredukuj zbędne wiadomości e-mail do minimum, zachowując jednocześnie alerty w czasie rzeczywistym w przypadku krytycznych opóźnień. 3) Rozszerz pulę podwozi i zmodernizuj sprzęt na placu, aby obsługa przepływu kontenerów była szybsza i bardziej niezawodna. 4) Przewoź więcej teu korytarzami lądowymi do centrów dystrybucji, priorytetowo traktując trasy kolejowe i bezpośrednie szlaki w celu minimalizacji zatorów na ostatniej mili. 5) Zabezpiecz wcześniejsze rezerwacje u spedytorów, aby usprawnić harmonogram i ograniczyć zmiany w ostatniej chwili, bazując na danych historycznych z grudnia i lutego. 6) Zwiększ zapasy paliwa i zapewnij lekką energię dla operacji terminalowych, aby utrzymać dłuższe zmiany bez przerw. 7) Wykorzystaj ukierunkowaną koordynację z regionalnymi dostawcami (w tym powiązanymi z Deyang), aby zdywersyfikować dostawy i uniknąć ryzyka jednego źródła. 8) Stwórz tematyczny, oparty na danych pulpit do monitorowania przepustowości, czasu składowania i dostępności sprzętu, aktualizowany co kilka godzin, aby przekształcić sieć przed nadejściem nowych fal. 9) Utwórz tymczasowe strefy postojowe na obszarze nabrzeża z kontrolowanym dostępem, aby złagodzić szczytowe wąskie gardła przy jednoczesnym zachowaniu bezpieczeństwa. 10) Utrzymuj ciągłą pętlę informacji zwrotnej ze spedytorami i firmami za pośrednictwem wiadomości e-mail i bezpośrednich kontaktów, aby zminimalizować stracony czas i utrzymać dynamikę w systemie.
| Aktywa/Obszar | Aktualny sygnał stresu | Interwencja | Czas realizacji | Prognozowany wpływ (teus/tydzień) |
|---|---|---|---|---|
| Kojami | Wysokie obłożenie, szczelne okna | Wydłużenie zmian, rezerwacja pasów priorytetowych | 2 tygodnie | +4 000 |
| Suwnice bramowe i sprzęt placowy | Duże obciążenie pracą, niedobór podwozi | Zwiększyć liczbę relokacji, dodać zapasowe dźwigi | 3 tygodnie | +6000 |
| Pule podwozi i transport ciężarowy | Ograniczona dostępność | Rozszerz pulę, zoptymalizuj routing, cross-docking | 2–3 weeks | +3500 |
| Przepustowość bramy | Kolejki formują się przy bramkach. | Procesy lean gate, kontrole przed bramkowe | 1 tydzień | +2000 |
| Korytarze lądowe (kolejowe/drogowe) | Niedobór slotów | Priorytetowe przydziały tras kolejowych, przesyłki bezpośrednio do węzła centralnego. | 1–2 weeks | +3000 |
| Paliwo i zasilanie | Zmienność podczas szczytów | Bezpieczne przechowywanie na miejscu, rozłożone w czasie tankowanie | 2 tygodnie | +1500 |
Co spowodowało wzrost cen: zamknięcia portów, spory pracownicze i ograniczenia przepustowości – wyjaśnienie
Aby złagodzić wzrost zatorów, operatorzy powinni już teraz zmienić harmonogramowanie: wprowadzić stopniowe przyjazdy, wydłużyć godziny pracy bram i przyspieszyć transfery lądowe, aby kontenery szybciej przemieszczały się w systemie. Wspólnie terminale, firmy transportowe i spedytorzy mogą skrócić czas postoju o 20-40% w godzinach szczytu, co pomoże im utrzymać się na czele i zmniejszyć zatory w szczycie.
Presje te wynikały z zamknięć bram, sporów pracowniczych i ograniczeń w zakresie możliwości obsługi, szczególnie w korytarzu Greater Los Angeles w Kalifornii. Obserwuje się wzrost aktywności, ponieważ popyt gwałtownie wzrósł w miesiącach po ustąpieniu pandemii, z nagłymi skokami aktywności skompresowanymi do kilku dni. W lipcu w wielu segmentach rozniosły się wieści o opóźnieniach, wywołując efekt domina, który dotarł do śródlądowych centrów transportowych. Nie były to odosobnione przypadki, odzwierciedlały one szersze zmiany w łańcuchu dostaw.
Kluczowe działania obejmują: harmonizację wspólnego cyklu prognozowania w przedsiębiorstwach i wśród partnerów rządowych, wymianę danych i uzgodnienie rozszerzeń godzin otwarcia bram. Wdrożenie elastycznych harmonogramów pracy w celu ograniczenia przeciążeń w okresach szczytowych i skrócenia czasu oczekiwania; inwestycje w automatyzację w celu zwiększenia przepustowości, z długoterminowym celem przekształcenia sieci pod względem tego, gdzie i jak wykorzystywana jest przepustowość. Kroki te są ważne dla utrzymania poziomu usług przy wzroście popytu, przy jednoczesnym skróceniu czasu przestoju i uniknięciu dalszych zatorów, które mogłyby rozprzestrzenić się na cały świat. W każdym segmencie wysiłek ten będzie wymagał ścisłej współpracy, aby cały łańcuch mógł pozostać zsynchronizowany, dzięki czemu będą lepiej przygotowani na następny wzrost.
W najbliższej perspektywie skupmy się na pięciu dźwigniach: poprawie przejrzystości, przyspieszeniu transportu lądowego, rozszerzeniu opcji przeładunkowych oraz wzmocnieniu relacji pracowniczych, aby zapobiec dalszej agresji w działalności operacyjnej. W ciągu najbliższych miesięcy okno możliwości utrzymania płynności łańcuchów dostaw będzie wymagało zintegrowanego planowania między spedytorami, przewoźnikami i operatorami terminali. W przypadku systemu Kalifornii oznacza to bardziej elastyczne okna czasowe dla transportu ciężarowego, lepsze harmonogramowanie i szersze dążenie do przesuwania towarów na wcześniejszym etapie podróży, aby świat mógł być zaopatrywany przez sezon festiwalowy i później. Potencjalne korzyści są ekscytujące i w zasięgu ręki, jeśli interesariusze będą działać razem.
Kluczowa przewaga tkwi w genie odporności zakorzenionym w tych przedsiębiorstwach i umiejętności wykorzystania danych. Istnieją twarde dowody na to, że skoordynowane działania mogą spłaszczyć szczyt, zapobiec przedłużającym się oczekiwaniom i utrzymać ruch handlowy, nawet jeśli wzrost utrzyma się do lipca i w kolejnych miesiącach. Koncentrując się na podstawach i dzieląc się informacjami, system może szybciej się odbudować i uniknąć powtarzania tego samego cyklu zatorów w przyszłych zakłóceniach. Moon przypomina nam, że ostrożne, wyważone reakcje wygrywają z pospiesznymi działaniami.
Aktualna mapa wpływu: które terminale są zatłoczone i jak długo statki pozostają na kotwicy
Recommendation: Zwiększyć efektywność przydzielania miejsc postojowych i wydłużyć okna wejścia, aby skrócić czas spędzony na wodzie; przenieść operacje z dala od wąskich gardeł, preferując najwcześniej dostępne miejsce postojowe i przyspieszając rezerwacje; wykorzystać kanały reklamowe do informowania interesariuszy, zmniejszając niepotrzebne ruchy i postoje na kotwicy.
Aktualna mapa wpływu wskazuje trzy terminale w klastrze LA–Long Beach jako najbardziej zatłoczone. W lipcu średni czas pobytu przy nabrzeżu w tych węzłach wynosi od około 28 do 60 godzin, przy czym dla terminalu Alfa jest to około 40 godzin, dla terminalu Beta blisko 37 godzin, a dla terminalu Gamma około 43 godzin. Wpływające statki ustawiają się w kolejce przed zwolnieniem, a opóźnienia rozprzestrzeniają się po sieciach śródlądowych, wpływając na miejsca pracy i wydatki w całym mieście.
Efekty ekonomiczne obejmują wyższe zużycie paliwa i większe wydatki na transport samochodowy i magazynowanie, a przepływy handlowe reagują na opóźnione zwolnienia bramowe. Historyczny wzrost spowodował ogromne, znaczące obciążenie operacji i zaufania wśród interesariuszy. Zakłócenia związane z COVID i inne dynamiki na przestrzeni lat kształtują planowanie zdolności produkcyjnych, a to jest sygnał, że korekty w harmonogramie mogą przywrócić przepływ.
Aby skrócić czas pobytu statków w portach i przyspieszyć powrót do normalnego funkcjonowania w nadchodzących miesiącach, władze powinny wdrożyć elastyczną koordynację miejsc cumowniczych, dostosować przemieszczanie ładunków na placach składowych do ich gotowości oraz prowadzić stałe prognozy wejść statków. Sytuacja na rynku kalifornijskim, związana z ograniczeniami covidowymi i wstrząsami zewnętrznymi, podkreśla znaczenie krótkoterminowych ulepszeń w zakresie czasu spędzanego na wodzie oraz obsługi wyładunkowej. Narracja związana z Sanxingdui wskazuje, że tematyczne okresy festiwalowe mogą stanowić obciążenie dla systemu; planowanie w tych okresach pozwoli opanować wzrost i uniknąć głębszego uderzenia w handel i przychody. Równolegle, wydatki na infrastrukturę i wzrost wydajności na przestrzeni lat przyniosą trwały znak odporności i wzrostu liczby miejsc pracy w centrach miast.
Konsekwencje dla łańcucha dostaw: opóźnienia w dostawach elektroniki, mebli i towarów łatwo psujących się
Rekomendacja: przekieruj krytyczne zamówienia do lądowych punktów przeładunkowych i, w miarę możliwości, przenieś pilne przesyłki na transport lotniczy. Zbuduj zapas bezpieczeństwa dla elektroniki, mebli i artykułów łatwo psujących się o wysokim popycie, odpowiadający 6–8 dniom typowego zużycia, oraz doprecyzuj harmonogramy dostawców, aby zabezpieczyć moce przerobowe u producentów kontraktowych (cmgs) i innych głównych przewoźników. Wykorzystuj samochody ciężarowe do transportu na ostatniej mili i wdrażaj przeładunek kompletacyjny (cross-docking), aby skrócić czas przestoju, pomagając tym graczom wyprzedzać wzrosty popytu.
Skutek: historyczny paraliż zachodnich terminali wejściowych wydłużył czas postoju kontenerów, powodując zwiększone zatłoczenie placów i mniejszą dostępność podwozi. Elektronika, taka jak telewizory i laptopy, doświadcza obecnie wydłużonych czasów realizacji, podczas gdy przesyłki mebli stoją w obliczu dłuższych cykli i wyższych kosztów przechowywania. Artykuły łatwo psujące się – owoce, nabiał i produkty gotowe do spożycia – są narażone na zepsucie, jeśli trasa nie zostanie zoptymalizowana. Równowaga sieci przesuwa się w głąb lądu, zwiększając ruch towarowy na wschód i podnosząc zużycie paliwa przez ciężarówki w związku z ograniczoną przepustowością wokół tych węzłów.
Koszty wynikają ze wzrostu stawek za kontenery, transportu lądowego i paliwa, przy jednoczesnym wzroście popytu. Wiele marek reaguje, dywersyfikując zaopatrzenie wokół śródlądowego węzła Pedro i wzdłuż korytarzy wschodnich, zmniejszając ekspozycję na pojedynczy punkt krytyczny. W przypadku pozycji podatnych na opóźnienia należy negocjować elastyczne harmonogramy produkcji i rezerwować moce produkcyjne z wyprzedzeniem; utrzymywać matrycę źródeł, która obejmuje wielu dostawców, aby zniwelować zakłócenia. Zbuduj rezerwę kontenerów i zabezpiecz miejsce w alternatywnych terminalach, aby uniknąć awarii w jednym punkcie.
Kroki operacyjne: mapowanie ścieżek krytycznych dla elektroniki, mebli i towarów łatwo psujących się z wykorzystaniem danych w czasie rzeczywistym z CMGS i narzędzi śledzenia kontenerów; koordynacja z inland gateways w celu utrzymania stałego przepływu i ograniczenia opóźnień. Nadawanie priorytetów kontenerom przewożącym SKU o wysokim popycie i skrócenie horyzontu planowania w celu minimalizacji czasu przestoju, z uwzględnieniem bliskich wysyłek. Utrzymanie elastycznego planu zaopatrzenia i dwutorowego routingu w celu utrzymania przepływu handlu wokół węzła Pedro i wzdłuż korytarzy wschodnich. Wdrażanie proaktywnych alertów do CMGS i partnerów przewozowych, aby działać zanim przepustowość się zmniejszy, zachowując dynamikę branży w obliczu bezprecedensowych wzrostów.
Alternatywne trasy i logistyka: przepustowość kolei, ograniczenia transportu drogowego i dostęp do zaplecza lądowego
Rekomendacja: Od poniedziałku przenieść wymierną część frachtu na korytarze kolejowe i śródlądowe sieci transportu drogowego, aby złagodzić historyczne spowolnienie w łańcuchach dostaw, które zakłóciło przepływ kontenerów i zwiększyło wydatki. Ukierunkować działania na pięć głównych szlaków handlowych i zoptymalizować przekazywanie między koleją a drogą, aby skrócić czas postoju kontenerów i złagodzić lutowe wzrosty.
Plan przepustowości kolei: Rozbudować terminale intermodalne w pobliżu tych pięciu korytarzy, zawrzeć umowy z prywatnymi operatorami w celu dodania pociągów dwupoziomowych i wydłużyć okna planowania, aby wykorzystać nocne i weekendowe przedziały czasowe. Wdrożyć system widoczności w czasie rzeczywistym, który umożliwi przekierowywanie kontenerów w miarę wzrostu popytu w sieci, a pierwsze etapy realizacji ustalić na następny miesiąc.
Ograniczenia w transporcie ciężarowym: Zwiększyć pule podwozi i utworzyć dedykowane pasy transportu drayage, aby skrócić czas odbioru. Wydłużyć godziny otwarcia bram w portach śródlądowych i oferować dzienne stawki motywacyjne, aby rozłożyć obciążenie pracą. Dostosować sygnały taryfowe, aby nagradzać terminowy odbiór i zmniejszyć czas przestoju, dążąc do wymiernego wzrostu terminowych dostaw w wynikach za luty.
Dostęp do zaplecza: Rozbuduj wewnętrzne centra połączone koleją i transportem lądowym z kluczowymi centrami konsumenckimi i produkcyjnymi, minimalizując odległość ostatniej mili. Koordynuj działania z przewoźnikami, aby zapewnić szybki transfer z kolei na drogę i odwrotnie, poprawiając dostęp dla firm polegających na imporcie i eksporcie wraz z istniejącymi łańcuchami dostaw.
Informatorzy zauważają, że podejście to wymaga starannego zarządzania kosztami i jasnego zarządzania. Leonard z dużej firmy podkreślił, że począwszy od tego tygodnia, nacisk na skoordynowaną wydajność i szybkość może przynieść świetne rezultaty, z wydatkami dostosowanymi do ważnych kamieni milowych i przejrzystym źródłem danych, które kierują decyzjami.
Działania, które spedytorzy mogą podjąć: ładunki priorytetowe, dokumentacja i aktualizacje w czasie rzeczywistym
Oznaczaj pilne pozycje w CMGS i wymagaj akceptacji zaktualizowanych EST od wszystkich partnerów, aby zapobiec pospiechowi zespołów. Te flagi powinny być widoczne na jednym pulpicie, aby przekształcić planowanie na styczniowy szczyt. Obszary wokół regionu Los Angeles, w tym pas wybrzeża, znajdują się pod bezprecedensową presją, a efekty kaskadowe w gospodarce mogą zakłócić nawet dobrze skoordynowane harmonogramy. Áine oznacza pozycje o znaczeniu krytycznym pod względem czasu w celu przyspieszenia obsługi i pomaga dyrektorowi koordynować reakcje.
Dyscyplina dokumentacyjna a jakość danych:
- Ustandaryzuj szablony cyfrowe i wymagaj akceptacji w ramach określonego SLA, aby ograniczyć wymianę wiadomości i nerwowe sytuacje na ostatnią chwilę.
- Używaj scentralizowanej platformy wymiany dokumentów; dołączaj istotne pola: nadawca, odbiorca, opis towaru, ilość, wartość, warunki, kraj pochodzenia, miejsce docelowe i przedział czasowy dostawy; polegaj na stałych aktualizacjach, aby zapewnić, że wszystkie strony widzą tę samą wersję i akceptują ją szybko.
- Weryfikuj rekordy przed przekazaniem; upewnij się, że są zgodne z kolejnym etapem i zredukuj przeróbki oraz problemy z komunikacją.
Aktualizacje i widoczność w czasie rzeczywistym:
- Włącz ujednolicony strumień statusów, który łączy systemy cmgs, ERP i systemy przewoźników; udostępnij wiele kanałów (e-maile, portal, SMS), aby informować wszystkich i zmniejszyć opóźnienia.
- Ukotwicz krytyczne punkty kontrolne (przybycie do bramy, odprawa, wyjazd z bramy) i publikuj krótkie “historie” z procesu; podejście mikro-dokumentalne może pomóc zespołom szybko się uczyć; te spostrzeżenia można udostępniać światu i poprawiać praktykę.
- Używaj podwójnego śledzenia dla strumieni danych; utrzymuj podstawowy kanał i kopię zapasową; monitoruj ostatnio uruchomione wzrosty w zmianach Szacowanego Czasu Przybycia (ETA) i odpowiednio dostosowuj plany.
Mogliby wymieniać się spostrzeżeniami za pomocą opowieści i form mikro-dokumentalnych, aby zmienić sposób funkcjonowania sieci na całym świecie.