

 Will Autonomous Trucks Put the Iron Horse Out to Pasture? An Analysis of Trucking Automation">

Answer: launch a staged rollout of autonomous trucks onto high-volume corridors to protect profit and sharpen operation as you validate performance with pilot routes.
Data from welborn analytics show that driver costs, benefits, and insurance push line-haul costs upward; automation can reduce the time behind the wheel and cut idling, which lowers fuels and maintenance. The mountain of data from pilot runs helps fleets quantify ROI, and margins are undervalued when assets sit idle. If fleets target routes with steady, predictable demand, automation can deliver a durable uplift in profit almost immediately, without requiring a full-scale replacement of the fleet.
For operators, the decision hinges on ROI, not just hardware. theyre risk tolerances align with pilot reliability, and the calls from shippers remain strong on corridors with consistent demand. In controlled lanes, uptime has improved; time to schedule is shrunk, and ground crews can repurpose roles to maintenance and data analytics. If a carrier wants to keep moving, they should stop chasing perfect autonomy and start a measured program that blends automation with human oversight, especially on routes used by exporter in cross-border trade.
Operational design matters: automation works best when fleets align with fuels price cycles, use electrified or alternative-fuel solutions, and consolidate routes to reduce empty miles, without being disruptive. The strategy favors a mix of long-haul automation and regional human-led operations, enabling ground teams to manage maintenance and software updates, while trucks operate in platoons that conserve fuel and improve safety. This approach keeps operators competitive and preserves jobs in support roles.
Bottom line: better resilience and profit come when automation augments the human operation rather than replacing it; fleets that pilot equipment without overshoot can maintain service levels for exporter and end customers, without sacrificing safety. The answer is not a binary yes or no: automation shifts the risk-reward curve and shortens time to scale, letting managers keep momentum while they test, adjust, and expand their networks onto new lanes.
Practical roadmap for fleets, regulators, and shippers facing automation hurdles
Recommendation: pursue a third track–governance–alongside pilot and scale. Implement a three-track rollout backed by a shared data pipeline and coreweaves analytics. In year one, run pilots on california corridors and another high-traffic route, measure speeds, braking, and collision avoidance, and translate those results into a value proposition for fleets and shippers. Offer a limited freebie to early adopters to accelerate learning while keeping downside risk manageable.
Fleets should build readiness by deploying smart sensors, standardizing data formats, and signing data-sharing agreements with suppliers. Create a staged adoption plan that keeps driver roles intact where safe and expands automation where speeds are stable. Mostly incremental upgrades should occur, with clear KPIs: haul time reduction, predictive maintenance, and improved on-time delivery. Having a tight change-control process reduces risk and protects the customer promise. Use harbo corridor pilots to calibrate loading patterns and dock operations. Be mindful that gains can be fleeting; design metrics to sustain throughput over year two. If results show improvement again in the next quarter, scale.
Regulators should require a formal safety case with scenario testing and third-party audits, plus dashboards that drive accountability. Establish an advisor panel to guide policy updates and weigh the impact on road safety. Set predictable timelines to avoid bottlenecks that stall investment. Monitor crash data and near-miss reports, align insurance models so premiums reflect actual risk, and publish behind-the-scenes summaries to inform stakeholders. This approach anchors trust and avoids an unplanned disruption.
Shippers should align contracts around transparent SLAs, risk-sharing terms, and shared KPIs for reliability and energy efficiency. Use a value-based pricing model that ties incentives to verifiable outcomes. Offer a freebie or pilot discount to accelerate adoption and build the pipeline of data those managers need. Track haul performance and set expectations that growth will be gradual but steady; that leads to a mostly smooth transition and reduces trailing delays in multi-stop networks. The article generated a practical playbook for ongoing collaboration between carriers, brokers, and manufacturers. Growing data streams from sensors inform dynamic routing decisions and justify continued collaboration with suppliers. For shippers, that means partnering with carriers that can deliver ongoing savings thats visible in quarterly reports. That is the core value advisor would offer to supply chain teams.
| Action | Właściciel | Timeline | Metryczny |
| Launch pilots on california corridors and harbo lanes | Fleets + Regulators | Year 1 | On-time haul rate, safety score |
| Establish data-sharing agreements and coreweaves pipeline | Fleets, Suppliers, Tech Partners | Q1–Q2 | Data completeness, pipeline throughput |
| Publish formal safety-case requirements and audits | Regulatorzy | Pytanie 2–Pytanie 3 | Audit pass rate, compliance time |
| Align insurance models and premiums with measured risk | Carriers, Insurers | Year 1–2 | Premium adjustments, risk-adjusted costs |
| Finalize SLAs and value-based contracts with shippers | Shippers, Carriers | Na bieżąco | Service reliability, savings realized |
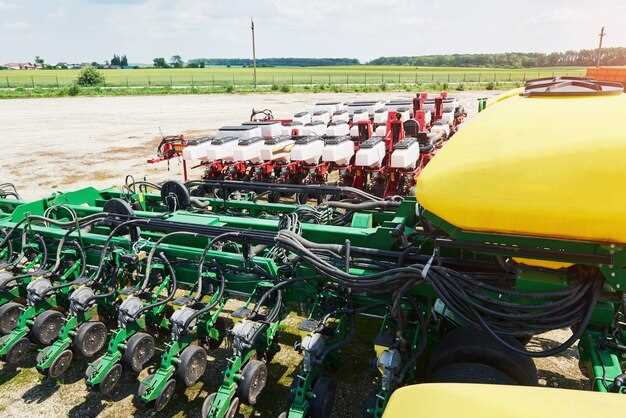
Current capabilities and limits of autonomous trucks on mainline routes
Recommendation: operate autonomous trucks on geofenced mainline corridors with continuous remote monitoring, a standing safety observer in the truck during early pilots, and a staged ramp-up tied to explicit milestones and disclosure to stakeholders.
On long, straight, well‑marked freeways, autonomous trucks currently maintain lane position, adapt speed to traffic, and execute routine merges with minimal human input. They can carry out standard exit maneuvers when a clear view and reliable map data exist, and a second operator is ready to take over if sensors detect an edge case. Platooning offers energy efficiency gains on these routes, while a safety‑monitoring layer keeps operations within approved performance envelopes. California‑based trials have demonstrated controlled movement on select corridors with measured on‑time performance and clear service level definitions, made possible by robust sensor suites and reliable communications.
Limitations appear where weather worsens, urban transitions begin, or construction zones complicate the geometry of the road. Edge cases, heavy traffic interchanges, and occlusion from bikes, pedestrians, or debris can trigger handovers to a human supervisor. Urban corridors and ramp-to-city transitions remain weak links; the system is highway‑first and requires a second driver or remote operator for many tricky situations. Weather, road surface conditions, and cybersecurity risks also constrain the reliability envelope and can disrupt ongoing operations.
Operations demand disciplined dispatch, maintenance, and disclosure. A single failure can disrupt a chain that touches port throughput, manufacturing, and retail delivery. An agreed safety case and standard operating procedures guide when to hand control to a human, when to pause for weather, and when to halt trips for inspections. The railroad case shows intermodal disruption can shift volumes to rail when trucks cannot run; authorities and customers expect clear letter of intent detailing expected service levels. If youd review the data, youd see how uptime, maintenance windows, and incident reporting shape trust in the program.
Economic dynamics influence decisions: the price per mile for autonomous operations remains higher in several markets due to equipment costs and ongoing supervision, but demand for capacity and driver shortages can push outcomes toward a favorable breakpoint as volumes grow. Good strategies align with existing trades and logistics flows, especially where intermodal links exist–urban corridors that connect with hubs can carry higher value when paired with rail shipments. Disclosure about reliability, maintenance windows, and contingency plans helps set realistic expectations and reduces trouble with customers. In California and Europe, pilots pursue a staged path that could lower price per mile as hardware costs fall and software matures, making the case for incremental gains that will carry through to broader deployments and long‑term ROI.
Anthony notes that the biggest gains come from lanes with stable traffic and clear weather, where the force of automation can form a predictable operating form. The stakes are high for a company that moves goods by trains and trucks, and the integration with railroad and intermodal partners shapes overall impact and disruption risk. Agreed, a measured expansion–with transparent disclosure and formal letters of intent–helps manage expectations and keeps urban and suburban corridors from becoming troubled ground. These conditions will not replace all drivers today, but they will shape steady progress on mainline routes while urban tests continue to refine the second‑phase capabilities and intermodal coordination needed for broader value.
Costs, financing, and return considerations for fleet automation
Phase a pilot with a clearly defined ROI target and lock in performance-based financing to align costs with realized gains.
Costs break into capital expenditure (capex) and ongoing operating expenses (opex). Capex covers the build of the automation stack–sensors, computing, perception software, actuators, and the integration layer with fleet management and ERP systems–plus installation and commissioning. Including integration with existing workflows, capex per vehicle typically ranges from 140k to 250k for a mid‑level kit, with higher figures for retrofit into older trucks or for more advanced autonomy levels. Averaged across a fleet, the upfront hit will depend on whether you’re building new units or upgrading existing stock, and on the complexity of route profiles. The production timeline for a phased rollout stays tight: a pilot may take 3–6 months, while full deployment can run 12–24 months depending on scale and supplier readiness.
Opex covers software subscriptions, cybersecurity, data services, maintenance, tire wear optimization, and driver retraining. Expect 8k–12k per vehicle per year in ongoing costs at scale, trending down as uptime improves and renewal cycles consolidate. There remains a margin between the cost of the automation system and the savings it delivers, driven by utilization and the quality of data integration. A well‑designed program reduces the cost of ownership over five years by shifting a portion of maintenance and fuel spend into predictable, line‑item savings.
Capacity gains come from higher uptime and better asset utilization, enabling bulk moves and longer-haul lanes that were previously constrained by driver fatigue rules. For an exporter with dispersed operations, the ability to carry higher payloads safely and reliably can reduce the “pocket” of inefficiency in regional markets. In practice, the improvement in capacity can push utilization from 70% to 85%–90% over time, with bigger effects on long‑haul and high‑density corridors. If demand spikes or volumes crash, the program must adapt quickly;荒 when volumes slump, payback slows unless SLAs and fuel-saving provisions protect the economics. This risk underscores the need for outside contingencies and a well‑stocked spare‑parts plan.
Financing options tailor capex timing to your cash flow. A phased approach works well, starting with a pilot funded through a mix of cash and equipment leases, then scaling with manufacturer or third‑party financing tied to performance. Options include:
- Direct ownership financed with a term loan, leveraging predictable fuel and maintenance savings to justify the debt service.
- Operating leases or finance leases that keep the automation assets off the balance sheet while preserving tax and renewal flexibility.
- True leases with a residual value, suitable for fleets that want to refresh technology every few years without large upfront outlays.
- Sale-leaseback arrangements for fleets with excess idle assets or for funding strategic upgrades without diverting working capital.
- Performance-based contracts with suppliers that release payments when uptime, fuel savings, or safety metrics hit targets, aligning risk with realized gains.
- Grants or incentives where available, plus tax credits or depreciation benefits that improve after‑tax economics.
Financing strategy should consider a “pocket of capital” for contingency repairs and quick replacements, since spare parts and integration support can vary by region. Partnering with vendors that offer bundled services–maintenance, over‑the‑air updates, and on‑site support–helps stabilize opex. In markets with volatile demand, a blended approach using capital and non‑capital financing keeps cash flow healthier and reduces the chance of a doom scenario where a single volume shock derails the plan.
Return considerations hinge on both financial and operational metrics. Financially, aim for a payback window of 2–5 years depending on mileage intensity and route complexity. An average IRR target in mature fleets ranges from the mid-teens to the low‑twenties when utilization is high and maintenance costs decline with automation maturity. Be sure to model a five‑year horizon to capture depreciation, tax shields, and renewal costs. Non‑financial returns–such as reductions in driver fatigue, improved safety, and more consistent service levels–support higher customer retention and potential premium pricing for reliable service.
Key performance indicators (KPIs) to track include total cost of ownership (TCO), fuel per mile, maintenance spend per mile, fleet availability, and average miles per unit. Track crash rates, near‑miss events, and compliance with hours‑of‑service rules; even modest drops in incident rates can translate to meaningful insurance savings and lower downtime. Averaged across several deployments, users often see fuel savings in the range of 5%–15% and maintenance reductions of 10%–20% after the first year of steady operation, with further gains as data‑driven maintenance and tire planning mature. When the project aligns with a robust service ecosystem, your capacity increases and external pressures–such as labor shortages or regulatory shifts–become less disruptive.
Risks and mitigating steps keep the economics sound. Demand volatility can dampen ROI, so stress-test scenarios with “outside” volumes and cross‑regional routes. Maintain a stock of critical spares to avoid service outages that ruin uptime. Engage vendors with proven onboarding playbooks (including Wyman‑type integrators or benchmark providers) to shorten ramp times and improve alignment with maintenance cycles. A disciplined rollout–with clear milestones, strong data governance, and integrated fleet‑planning tools–reduces the chance of a single incident driving the project into a bad outcome. If markets shift or a major carrier adjusts capacity, the program should adapt rather than stall, preserving the higher stakes of automation investments in the long run.
Bottom line: start with a tight pilot, secure performance-based financing, and scale only after achieving defined savings and uptime targets. A disciplined approach that links capex to measurable gains, while maintaining a safety stock and flexible financing, turns opportunities like higher capacity and bulk routing into durable, value‑creating services rather than speculative bets. If you track the right mix of production efficiency, cost discipline, and reliability, the path to profitable automation remains clear rather than daunting.
Wymagania regulacyjne, zatwierdzenia i atesty bezpieczeństwa w praktyce
Zanim rozpoczną się jakiekolwiek testy na drogach publicznych, należy przygotować formalny raport bezpieczeństwa i uzyskać zabezpieczone zgody regulacyjne. Raport dokumentuje analizę zagrożeń, potencjalne tryby awarii, środki łagodzące i kryteria akceptacji i jest dołączony do cykli przeglądów regulatora, tak aby przeglądy odbywały się w przewidywalnych odstępach czasu. Takie podejście minimalizuje opóźnienia i zapewnia postęp platformy i zasobów, przy jednoczesnym zachowaniu zgodności z wymogami środowiskowymi i oczekiwaniami branży.
Angażuj władze na wczesnym etapie i prowadź transparentny dialog. W Stanach Zjednoczonych droga prowadzi przez FMCSA, NHTSA i DOT, a agencje stanowe wydają pozwolenia dotyczące konkretnych lokalizacji. W innych regionach proces kształtują przepisy UNECE WP.29 i ministerstwa krajowe. Uzgodnij kamienie milowe i przedstaw pakiety danych, które organy regulacyjne mogą przeanalizować i uzgodnić; obszary zainteresowania zazwyczaj obejmują zarządzanie, zarządzanie ryzykiem, cyberbezpieczeństwo i przetwarzanie danych.
Normy i certyfikaty bezpieczeństwa wymagają rygorystycznych dowodów. Dostosuj się do poziomów SAE J3016, aby zdefiniować autonomię, zastosuj ISO 26262 dla bezpieczeństwa funkcjonalnego i przyjmij ISO 21434 dla cyberbezpieczeństwa. W przypadku operacji środowiskowych i pojazdów ciężarowych, zapewnij zgodność z obowiązującymi FMVSS i regionalnymi normami bezpieczeństwa. Ścieżka certyfikacji obejmuje symulacje, pilotaże drogowe i audyty stron trzecich; koszt i ramy czasowe wpływają na budżety projektów i decyzje w skali mierzonej w miliardach.
Weryfikacja odbywa się poprzez warstwowy plan testowania. Wykorzystaj symulacje, systemy HIL (hardware-in-the-loop) i kontrolowane testy w rzeczywistych warunkach, aby zbudować wiarygodny rejestr ryzyka. W przypadku flot pojazdów elektrycznych zasilanych bateriami, zintegruj testy bezpieczeństwa baterii, zarządzania temperaturą, przepustowości ładowania i wytrzymałości. Utrzymuj dane środowiskowe w centrum procesu i śledź linie telemetrii w całej flocie, aby wykazać bezpieczną eksploatację na dużą skalę.
Głosy branży zakotwiczają praktykę. Dane Raimondi i Cenovus pokazują, że programy pilotażowe zakotwiczone w jasnych metrykach bezpieczeństwa i pulpitach nawigacyjnych skierowanych do organów regulacyjnych mają tendencję do skracania cykli zatwierdzania. Johanson, menedżer floty, zauważa, że linie telemetryczne i oceny ryzyka prezentowane organom regulacyjnym pomagają budować zaufanie, umożliwiając jednocześnie eksploatację aktywów w ramach uzgodnionych limitów. Inwestorzy Buffetta szukają przewidywalnych harmonogramów i rozważnej alokacji kapitału, aby wspierać plany wdrożeniowe.
Aby przyspieszyć osiąganie celów, planuj budżety z uwzględnieniem inflacji i ustal jasne tempo zatwierdzeń. Megatrend w kierunku inteligentniejszych, podlegających audytowi operacji nagradza tych, którzy pierwsi dostosują modernizacje platform, zamówienia flotowe i platformy danych do etapów regulacyjnych. Dostarczanie lepszej widoczności ryzyka i udokumentowanego bezpieczeństwa pozwala na dynamiczną rozbudowę floty i skalowanie aktywów.
Implikacje dla zatrudnienia: role kierowców, potrzeby szkoleniowe i ścieżki transformacji
Zaplanuj etapową ścieżkę przekwalifikowania, która w ciągu 12 miesięcy przekształci kierowców w specjalistów ds. koordynacji floty i monitorowania bezpieczeństwa. Pozwoli to zatrzymać cennych pracowników, jednocześnie budując silny trzon operatorów, którzy będą mogli utrzymać niezawodność w miarę rozwoju automatyzacji.
Przesunięcie napędzają względy bezpieczeństwa, przewidywalność kosztów i spójność usług. Typowe wdrożenia przesuwają kierowców do nadzoru, interpretacji danych i obsługi wyjątków, podczas gdy automatyzacja zajmuje się odcinkami długodystansowymi i rutynowym wyznaczaniem tras. Taki podział utrzymuje kierowców na cenionych stanowiskach i pozwala uniknąć hurtowej utraty talentów, a pracownicy chcą jasnej ścieżki rozwoju, aby awansować w karierze. Jeśli nie zostanie to zaplanowane, zespoły mogą stracić wiedzę ukrytą, a wyniki mogą być gorsze.
Efektywność paliwowa i wykorzystanie zasobów poprawiają się, gdy lokalne zespoły współpracują z automatyzacją. W większych flotach skoordynowana jazda i ciągła gotowość mogą zaoszczędzić wymierne ilości baryłek paliwa miesięcznie i poprawić czas sprawności. Te zyski wspierają przychody, jednocześnie stabilizując koszty operacyjne podczas transformacji, a także pomagają utrzymać relacje z klientami w różnych obszarach działalności.
Sygnały i ujawnienia branżowe mają znaczenie. Dane Nasdaq pokazują, że inwestorzy pozytywnie reagują na przejrzyste ujawnienia dotyczące transformacji siły roboczej i starannie skonstruowane plany ofert. Anthony z działu badań powiązanego z Nasdaq zauważa, że rynki nagradzają przejrzystość w zakresie inwestycji w szkolenia i utrzymanie talentów. Plan, który łączy platformy szkoleniowe wspierane przez Microsoft z symulacjami chmurowymi Coreweave, może być szybko skalowany, umożliwiając pilotaże na podzbiorze tras przed szerszym wdrożeniem. Takie podejście minimalizuje zakłócenia i utrzymuje poziom usług, oferując jednocześnie korzyści dla innych podmiotów w ekosystemie.
- Ocena i mapowanie: inwentaryzacja umiejętności kierowców, identyfikacja ról odpowiednich do przeniesienia oraz określenie wymaganych modułów szkoleniowych.
- Podnoszenie kwalifikacji: wdrożenie modułów dotyczących interfejsów automatyzacji, pulpitów nawigacyjnych telematyki, umiejętności korzystania z danych i protokołów bezpieczeństwa; uwzględnienie umiejętności miękkich, takich jak zarządzanie zmianą i komunikacja z klientem; określenie docelowych czasów ukończenia i certyfikatów.
- Przeniesienie i utrzymanie kadr: przydzielanie kierowców do wsparcia dyspozytorskiego, koordynacji konserwacji lub roli łącznika obsługi klienta; ustanowienie przedziałów płacowych i ścieżek kariery powiązanych z wynikami i certyfikacją.
- Ujawnienie i zarządzanie: opublikuj plan transformacji siły roboczej dla interesariuszy, dostosuj się do oczekiwań regulacyjnych lub inwestorów i oferuj stypendia lub świadczenia na przekwalifikowanie, aby zachować wiedzę instytucjonalną.
- Pomiar i iteracja: śledź incydenty związane z bezpieczeństwem, czas sprawności, przebieg, zużycie paliwa, retencję kierowców i ukończenie szkoleń; dostosowuj treści i system motywacyjny po kwartalnych przeglądach.
Inne działania, takie jak utrzymywanie silnego mentoringu i zapewnienie dostępu do mikro-certyfikatów, pomagają utrzymać wysokie morale i zminimalizować zakłócenia. Połączenie praktycznego podnoszenia kwalifikacji i jasnego planu wspiera przychody firmy i wzmacnia pozycję na rynkach, w tym wśród spółek notowanych na Nasdaq i innych podmiotów w ekosystemie.
Infrastruktura i operacje: utrzymanie, mapowanie, cyberbezpieczeństwo i zarządzanie danymi
Zainwestowane środki powinny być skierowane na jednolity program konserwacji i telematyki dla całej floty, z wewnętrznym właścicielem odpowiedzialnym za jakość danych. Zainstaluj urządzenia brzegowe do monitorowania zużycia silnika, zużycia paliwa i stanu hamulców oraz uruchom pulpity nawigacyjne na żywo, które w ciągu kilku minut sygnalizują anomalie. Ustal roczny kalendarz przeglądów, który przekształca alerty z czujników w zlecenia robocze, skracając przestoje i kosztowne wezwania pomocy drogowej. Wykazano, że takie podejście obniża ogólne koszty konserwacji i poprawia czas sprawności.
Do mapowania, utrzymuj mapy w wysokiej rozdzielczości z poziomem szczegółowości do pasa ruchu, dynamiczne warstwy zagrożeń i redundancję dla pogorszonej łączności. Używaj aktualizacji OTA, aby dane były aktualne i ustaw dwustopniową akceptację zmian: dane z terenu plus walidacja podstawowej mapy od autora. Przechowuj pochodzenie mapy w dedykowanym pomieszczeniu w jeziorze danych i dokumentuj zmiany w cyklach miesięcznych, aby uniknąć rozbieżności.
Cyberbezpieczeństwo: Wdrażaj ramy zero-trust dla pojazdów, urządzeń przydrożnych i usług w chmurze. Wymuszaj bezpieczeństwo zakorzenione w sprzęcie, bezpieczny rozruch i podpisane oprogramowanie układowe dla modułów sterowania silnikiem i aplikacji flotowych. Używaj wzajemnego TLS, silnego zarządzania tożsamością i segmentacji sieci między ciężarówkami, zajezdniami i chmurą. Przeprowadzaj kwartalne ćwiczenia symulacyjne i bieżący monitoring za pomocą rozwiązań Microsoft Security aktualnie wdrożonych w Europie, aby wspierać wykrywanie i reagowanie.
Zarządzanie danymi: Zdefiniuj politykę, która oddziela producentów danych (zespoły utrzymania, telemetria pojazdów) od konsumentów danych (operacje, bezpieczeństwo, planowanie) oraz wymianę danych między partnerami. Stwórz katalog metadanych, drzewo pochodzenia danych, zasady retencji i ścieżki audytu; domyślnie ogranicz udostępnianie zewnętrzne i wymagaj ocen ryzyka dostawców dla każdego dostępu partnera. Ustanów jasną, uporządkowaną strukturę zarządzania, prowadzoną przez autora, i zbieraj opinie od wewnętrznych interesariuszy oraz firmy Johanson jako punkt odniesienia, aby uzgodnić własność i odpowiedzialność za dane; śledź postępy w zakresie zgodności i jakości danych.
Plan wdrożeniowy i zakres regionalny: przeprowadzić pilotaże w Europie i w korytarzach Santa z operacjami na pełnych trasach, aby określić korzyści. Dostosować decyzje zakupowe dotyczące czujników, map HD i narzędzi zabezpieczających do zainwestowanych środków. Mierzyć czas sprawności, oszczędność paliwa i koszt utrzymania na milę na podstawie 6–12 miesięcy danych na żywo. Historia pokazuje, że floty, które integrują te obszary, obniżają całkowity koszt na milę. Zebrać opinie od autora i przedstawicieli branży; podsumować korzyści i wnioski dla kolejnej fali wdrażania. Stworzyć pokój zarządzania w celu koordynowania udostępniania danych z dostawcami ropy i producentami silników, wzmacniając strategię zrównoważonego transportu i zapewniając gotowość do szerszego wdrożenia dzięki pilotażom WeRide.