

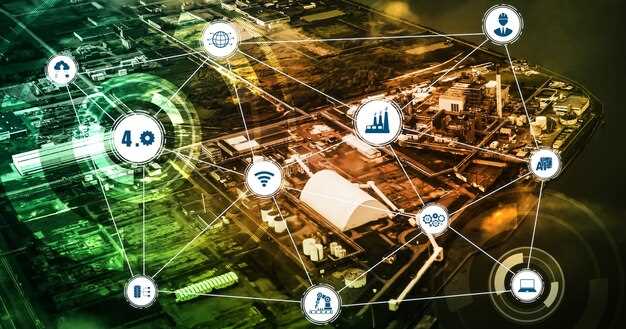
 6 Benefits of Distribution Network Analysis">

Dağıtım ağlarınızdaki tüm düğümleri haritalandırarak başlayın, ardından başlayın görselleştirme kaynağından müşteriye siparişlerin akışı. Bu anında adım, ortaya çıkarır kritik tıkanıklıklar ve risks zincirin her halkasında gizleniyor. ERP, WMS ve taşıma sistemlerinizden gelen veriler gerçeğin kaynağı olduğundan, bunları tek bir görüntüde birleştirin ve somut, eyleme geçirilebilir eylemlere dönüştürün. Sistemin her siparişini takip ederek koordinasyonu sıkılaştırın.
İkinci olarak, kapasiteyi ve envanteri hizalayın. plans gerçek kısıtlamalara, stokta kalmama durumunu hafifletmenize ve 10–25% oranında güvenlik stokunu azaltmanıza olanak tanıyarak. Mevsimselliği, teslim sürelerini ve taşıyıcı kapasitesini tek bir modelde modelleyerek, acil gönderileri 20% oranında azaltabilecek ve her birini hizalayabilecek kararlar oluşturursunuz. order optimal stok ve ikmal zamanlaması ile. Bu yaklaşım maliyetleri daha da optimize edebilir.
Üçüncüsü, show yönetici ve operasyon ekipleri insights ağlara complexities ve ödünleşimleri. Görsel senaryo analizi, rotaları, depoları ve son mil seçeneklerini karşılaştırmanıza yardımcı olur, böylece en iyisini seçebilirsiniz. değerli belirli bir hizmet hedefi için yapılandırma.
Dördüncüsü, içgörüleri eyleme dönüştürerek yürütmeyi sıkılaştırın. Tanımlayın plans ağları yeniden düzenlemek, depoları konsolide etmek ve filo kaynaklarını yeniden tahsis etmek için. Ne olurdu senaryoları kullan. senaryolar etkiyi tahmin etmek için order döngü süreleri, maliyetler ve karbon ayak izi. Bu, yönetişimi kritik ve değerli dağıtım kararları veren kişi için.
Son olarak, ağınızın büyümesiyle ölçeklenebildiğinden tekrarlanabilir bir iş akışı oluşturun. Veri akışlarını sürekli olarak entegre edin, otomatikleştirin. görselleştirme ve raporlama, ayrıca panoların oluşturulmasını ve show hedeflere karşı ilerleme. Bu tekrarlanabilir yaklaşım, sonuç verir. değerli sürekli optimizasyon için bilgiler ve olabilir Gerekirse tedarikçi ağlarına ve son mil ortaklarına kadar genişletilebilir.
Dağıtım Ağı Analizi: Pratik Bir Plan
Aşama aşama, veri odaklı bir dağıtım ağı uygulayarak kesintileri % azaltın ve altı ay içinde müşteri memnuniyetini artırın. Departmanlar, şirket ve lojistik ortaklar arasında karmaşık ilişkileri yakalayan yapılandırılmış bir temel oluşturun, ardından analizleri hızla okumak için kullanın ve bu bulguları eylemi yönlendirmek için kullanın.
1. Aşama veri toplamaya odaklanır: envanter düğümleri, rotalar, talep sinyalleri, hizmet seviyeleri ve çevresel faktörler. Kritik düğümler için dijital ikizler oluşturarak senaryoları test edin, ardından sonuçları merkezi bir analitik çıktıya bağlayarak ekip içi inceleme için kullanın.
2. Aşama, bağımlılıkları haritalandırır ve akışların, stok arabelleklerinin ve teslim sürelerinin yapılandırılmış bir modelini oluşturur. En etkili değişiklikleri belirleyin, örneğin darboğazların etrafından yönlendirme veya politika sınırları dahilinde güvenlik stoklarını ayarlama ve departmanlar bazında sahipleri belgeleyin.
Aşamada 3, hava durumu, trafik, tedarikçi gecikmeleri veya BT kesintilerinden kaynaklanan aksamalar için senaryolar çalıştırılır. Maliyet, hizmet memnuniyeti ve çevresel etki ile ilişkili KPI’larda sonuçları yakalayın ve en kısa uygun zaman dilimi içinde azaltıcı adımları uygulamak için bir plan oluşturun.
4. Aşama değişiklikleri uygulamaya koyar: en kritik bölgelerde pilot lansmanlarını başlatın, gerçek zamanlı gösterge panolarında performansı izleyin ve sonuçları şirket ve tüm ilgili departmanlarla paylaşmak üzere resmi bir devri hazırlayın.
| Stage | Eylem | Sahip/Departman | KPIs | Zaman Çizelgesi |
|---|---|---|---|---|
| Veri toplama | Envanter düğümleri, rotalar, talepler | Operations, Logistics | Veri bütünlüğü, eşleşme oranı | 0–4 weeks |
| Modeling | Bağımlılıkları haritalandırın, stok arabelleklerini ayarlayın | Planlama, Tedarik | Stok kapsamı, teslimat süreleri | 4–8 weeks |
| Senaryo testi | Disruptions simulations | Analitik, Risk | Hizmet seviyeleri, maliyet etkisi | 2–6 weeks |
| Implementation | Pilot uygulama | Ops, BT, Tedarik | Pilot sonuçları, tırmanmalar | 6–12 hafta |
| Review | Okuma ve ölçeklendirme | Tüm departmanlar | Okumalar, memnuniyet, çevresel metrikler | Devam ediyor |
Her aşamadan gelen veriler, planı besleyerek paydaşlardan sürekli destek ve kesintilerde istikrarlı bir azalma sağlarken sürdürülebilirlik hedeflerini operasyonel adımlarla uyumlu hale getirir.
Ağ analizi, hizmet seviyelerini ve sipariş doldurma oranını nasıl artırır?
Rotaları, depoları ve envanteri hizalamak için gerçek zamanlı ağ analizi uygulayın, böylece hizmet seviyeleri yükselsin ve sipariş karşılama oranı iyileşsin. Gelen olaylarla birlikte güncellenen tek, grafiksel bir ağ görünümü oluşturun ve planlama ve operasyon ekipleri için veri erişimini sorunsuz tutun.
By analyzing routes, facilities, and carrier policies, you reduce travel time, shorten replenishment timeline, and improve fulfillment. When demand shifts or conditions change, a well-kept model suggests the fastest routes and the best stock placement to maintain service levels and minimize risk for them and customers.
Use techniques such as graph-based optimization, scenario simulation, clustering, and demand forecasting to translate data into an understandable strategy. Graphical dashboards present trends, exceptions, and timeline milestones in a few seconds, making monitoring results obvious to non-technical stakeholders and reducing reliance on manual interpretation. Some examples illustrate how different routes and stock placements influence fulfillment under varying conditions.
Implementation steps with a timeline: First, build the network model by mapping facilities, routes, transit times, service windows, and policy constraints. Second, define service-level policies and inventory thresholds that reflect targets for on-time delivery, fill rate, and backorder risk. Third, establish real-time data feeds and monitoring, so issues come to light quickly. Fourth, run some scenario analyses to test responses to demand surges or disruptions. Fifth, monitor performance and adjust the strategy continuously to improve fulfillment while keeping the timeline tight.
Examples: A regional retailer reduced late deliveries by double-digit percentages after rerouting to closer hubs and adjusting dock-to-ship times; a distributor improved order fill rate by a measurable margin by aligning supplier lead times with production schedules. These gains came from tightening access to data, reducing reliance on guesswork, and enforcing clear policies across teams.
To make this repeatable, document a living strategy that teams can follow when conditions change. Use real-time feedback loops, integrate suppliers and carriers, and keep the timeline visible to leadership. With this approach, distribution networks stay resilient, fulfillment stays predictable, and service levels stay high.
Which routes, locations, and warehouse options yield the biggest cost reductions?
Recommendation: Centralize near-demand into 2 regional micro-fulfillment hubs along the strongest customer corridors. This shift pays off just in the first year with transportation costs reduced by 8–14% and inventory carrying costs lowered by 4–7%, while boosting service levels for distributors and customers. Use a technology-enabled model to size hubs and route flows, so the organization can respond to changing demand with enhanced agility.
Routes matter most on core paths with high volume density. Analyze data to identify routes carrying 60–70% of orders and re-route through the hub-and-spoke network. Expect 6–12% reductions in transportation costs on these core paths, with last-mile improvements for urban customers. This path-focused optimization reduces disruptions and stabilizes costs even when fuel spikes occur.
Locations drive savings when hubs sit near dense customer clusters. Place 2–4 micro-fulfillment centers within 10–25 miles of major urban areas and 25–40 miles of regional corridors. This reduces last-mile transport by 25–30% and enables same- or next-day fulfillment for 30–45% of orders, cutting total cost per order and improving customer satisfaction.
Warehouse options and fulfillment strategies matter. Combine MFCs with cross-docking at regional hubs to minimize handling, storage, and dwell time. Cross-docking can reduce labor cost per unit by 8–12% and lower stock turnover time through faster movement; automation and smart sorting enhance accuracy and throughput.
Technology and data underpin the best results. Build a continuous optimization model that uses a graph of routes, warehouse nodes, and service levels. Track trends over time and run what-if scenarios to compare direct shipping against hub-based fulfillment. Use real-time data from transportation providers and distributors to continuously adjust the path and mitigate risk. The model provides enhanced visibility, enables problem-solving, and supports change management across the organization.
Mitigating disruption requires resilience. Include spare routes and buffer stock for top SKUs, diversify carriers, and monitor fuel, capacity, and weather patterns via a dashboard. When disruptions occur, trigger predefined rerouting and adapt fulfillment options to keep costs down while maintaining service levels.
Implementation steps and KPIs: Start with a 90-day pilot across two regions, compare baseline costs vs hub-based costs, track transportation cost per unit, last-mile cost per order, inventory turns, and on-time delivery rate. Use a data-driven graph to visualize cost trends and quantify best opportunities. After pilot, scale to additional regions and gradually replace long-tail routes with optimized core paths. Maintain continuous feedback with distributors and customers to sustain cost reductions and improve service through automation and change management.
How can you optimize the warehouse footprint and inventory positioning?
Start with a data-driven footprint assessment and slotting plan to cut travel distances by 15–25% and improve order fill rates. This approach directly impacts picking speed and space utilization.
Since space is costly and demand patterns shift, evaluating the current layout against actual activity helps you forecast where to place items along the main flows. The goal is better alignment of stock with picking routes, along supply chains from receiving to dispatch, thus reducing handling steps.
- Evaluate the current footprint using a density map of storage areas, aisles, and pick faces. Capture details such as shelf height, pallet footprint, and available cubic meters to identify underutilized zones and pinch points.
- Classify inventory with ABC analysis and place A items near packing/shipping, B items in secondary lanes, and C items in slower zones. This placing supports easier procurement and replenishment planning.
- Implement slotting optimization that updates weekly or daily based on forecast, demand patterns, and seasonality. Move items to minimize average travel distance and cross-dock where feasible.
- Design picking zones (zone or batch picking) that reduce back-and-forth movements. Use cross-docking for inbound goods to accelerate availability and simplify flow along chains.
- Position fast-moving items in main aisles and near the dispatch area; slow movers go deeper in the rack. Consider dynamic slotting to adapt as things change; the system should anticipate shifts in demand.
- Leverage online orders to drive dynamic slotting rules. Tie WMS guidance to real-time inventory status to prevent stockouts and overshoots.
- Implement clear location codes and signage that provide instant decision support at the place of picking, ensuring that workers can navigate quickly and record movements accurately.
- Define decision rules and performance metrics that cover activities such as receiving, put-away, replenishment, order picking, and packing. Track KPIs like space utilization, travel time per order, and order cycle time.
- Coordinate with procurement to align replenishment with forecasted demand and safety stock levels, avoiding excess inventory while preserving service levels.
- Test changes in a controlled situation: pilot a zone, measure impact, then roll out across the facility with proper change management.
Thus, the combined focus on assessing footprints, aligning placement with forecast, and tightening the link between procurement, demand, and picking activities helps you reduce distance traveled, speed up fulfillment, and improve service levels across online and offline channels.
Where can transportation costs be reduced through mode and route optimization?

Adopt a mode-and-route optimization plan that shifts long-haul freight to rail or intermodal where capacity and terminals support reliable transit times, and consolidate shipments to reduce handling and empty miles. This approach commonly yields 10-25% cost reductions on core flows and lowers delivery variability, which is achievable only when the network design aligns capacity, routing options, and terminal availability. Use a data-driven model to determine the optimal mix for each lane, balance cost with service and maintain reliability. lets focus on the most impactful routes first, then expand.
Routes between locations with high freight density and favorable modal feasibility respond fastest to optimization. By using intermodal legs, you cut per-ton-mile costs and reduce fuel consumption. Visualizing the network helps reveal inefficiencies, such as unnecessary detours or idle times, and the resulting plan clearly shows where decision-making should target gains. This approach also helps balance throughput across terminals and carriers, aligning strategies across actors for smoother handoffs.
Deeper insights come from analyzing dependencies among modes, carriers, and terminals. Using this data, you can design routes that minimize empty miles, maintain service windows, and reduce handling steps. Geopolitical and environmental considerations shape routing choices–for example, selecting corridors with stable policy, favorable tariffs, and lower emissions. The resulting routes are robust, while maintaining required service levels.
To implement, start with a pilot on 6-8 lanes, track cost-per-ton-km, on-time performance, and container utilization, then scale. lets build a visual dashboard that highlights key locations and the routes between them, so stakeholders across functions can see insights at a glance. The dashboard enhances decision-making and keeps the team aligned on targets and timelines.
Bottom line: mode and route optimization lowers inefficiencies and boosts reliability by choosing the right mode for each leg and by selecting routes that optimize distances, dwell times, and transfers. The combination of environmental benefits and geopolitical risk reduction creates a tangible gain in total landed cost, while maintaining customer expectations and reducing risk for supply chain actors.
How to align distribution insights with demand planning and forecasting?
Use one or more platformlar that automatically convert distribution insights into demand signals and feed forecasting models in real time. Link distribution KPIs–service levels, stockouts, transit times, and order cycles–directly to forecast inputs so planners can act fast.
Create a governance layer in the enterprise hizalamak için objectives across supply, sales, and operations. Define measurable targets for forecast accuracy, service levels, inventory turns, and cost per filled order; tie incentives to these metrics to sustain momentum.
Map data flows and establish monitoring karşısında chains, warehouses, and stores; ensure data quality through automated checks and time stamps. Use seamless data feeds from vendors, carriers, and stores to feed forecasting models, providing a unified view for müşteriler and planners alike.
Align planning horizons and processes: daily replenishment signals feed weekly demand reviews and monthly projections; account for market conditions and certain trigger thresholds, and ensure cross-functional processes are synchronized so changes propagate everywhere throughout the chain.
Plan for aksaklıklar: build scenario plans for supplier delays, weather events, or capacity constraints; define explicit actions and prioritize responses to protect service levels with minimal cost.
Operationalize actions: risk ve etkiye göre yeniden sıralama noktaları, güvenlik stoğu arabellekleri ve taşıma seçeneklerini ayarlayın; sonuçları izleyin ve korumak için hızla ayarlamalar yapın seamless servis için müşteriler.
Önlemler ve iyileştirme: takip değerli forecast accuracy, bias, MAPE, hizmet düzeyi başarımı ve stok devir hızı gibi ölçütler; sürekli kullanımı monitoring boşlukları kapatmak ve iyileştirmeyi processes.
İlgilendirmek maker ürün, lojistik ve BT ekipleri arasında işbirliği yaparak pratik kullanımın sağlanması; bir üretici zihniyeti, tasarlanan gösterge tablolarının easy yorumlamak ve harekete geçirmek için.
keerthisena, dağıtım içgörülerini talep planlamasına pratik bir ritimle entegre ederek vurguluyor. providing saha koşullarından zamanında geri bildirimleri tahminlere aktararak, uygulama ekiplerinin hızlı ve şeffaf bir şekilde hareket etmelerini sağlamak, throughout the enterprise.
Analitikler, ROI odaklı sermaye harcaması kararlarını ve risk azaltımını nasıl destekleyebilir?
Tahmin temelli bir capex skor kartı ile projeleri ROI ve risk sonuçlarına bağlayın. Dağıtım ağları için en etkili yatırımlar stok seviyelerini ve karşılama hızını etkilerken, aynı zamanda işletme sermayesini de dengeler. Analitikler, her seçeneğin sonuçlarını nicelendirir, senaryoları hızla karşılaştırır ve zaten yönetim tarafından onaylanacak ilk planı destekler.
Senaryo planlaması ve tahmin modellerini kullanarak talebi, kesinti olasılığını ve taşıma maliyetlerini tahmin edin. Sezgisel olarak, yüksek talep bölgelerine yakın kapasite eklemek stoksuz kalmayı azaltır ve hizmeti iyileştirir, bu da gelir akışını artırır. Tahmin odaklı içgörüler, seçenekleri seçmek ve risk ayarlamalı getirileri hesaplamak için geliştirilmiş netlik sağlar ve bu da yönetim tartışmalarını bilgilendirir.
Bir capex karar süreci uygulamak, KPI'ları her seçeneğe bağlayan bir plan oluşturmak anlamına gelir: tahmin doğruluğu, stok devri, yerine getirme verimliliği ve ulaşım harcamaları. ROI'yi, geri ödemeyi ve risk maruziyetini düğümler, depolar ve rotalar arasında karşılaştıran bir karar matrisi oluşturun. Bu plan yönetim tarafından gözden geçirilmeli, pilotları onaylama ve ağın geri kalanına ölçeklendirme yetkisine sahip olmalıdır.
Dağıtımdan sonra performansı izlemek için canlı bir gösterge paneli kullanın ve tahminler farklılaşırsa planı hızla ayarlayın. Amaç, sapmaları erken yakalayarak ve kapasiteyi, envanteri veya taşımayı en çok ihtiyaç duyulan yere yeniden tahsis ederek sonuçları önlemektir. Sadece sermaye kararlarını tahmin güvenilirliğine bağlayarak işletmeler tutarlı sonuçlar elde edebilir, gizli maliyetleri azaltabilir ve daha hızlı, daha güvenli kararlar sağlayabilir.