


Implement Штучний інтелект monitoring across processing lines to detect anomalies in vibration, temperature, and throughput, and to adjust parameters on equipment in real time. Across the field, AI models learn from sensor data to predict wear, schedule maintenance, and minimize unplanned downtime.
Real-world applications span automated defect detection with vision systems, predictive maintenance for rotating machinery, energy optimization, and inventory-aware scheduling. These use cases deliver downtime reductions of 15-30% and scrap reductions in the single digits to mid-teens, while increasing throughput by 5-20% on mature lines.
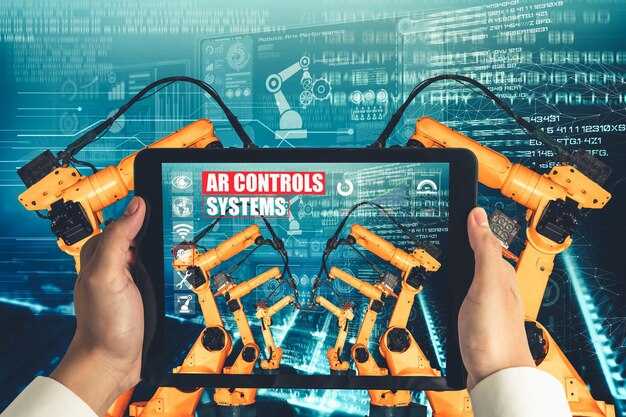
Trends point to modular, edge-friendly рішення that integrate processing data from large fleets of equipment, увімкнюючи future capabilities and shifting the heart of plant operations toward more autonomous control.
To begin, run a field evaluation to identify high-impact use cases in processing, equipment reliability, and inventory management. Run a 90-day pilot on one line, measure improvements in downtime, scrap, and throughput, then scale to other lines.
Choose vendors with proven industrial deployments, robust evaluation pipelines, and transparent data governance. Ensure the solution can integrate with ERP and маркетинг workflows to prove value to stakeholders, and demand clear roadmaps for interoperability with existing systems.
Measure success with concrete metrics such as OEE, scrap rate, and mean time between failures, and track progress across quarters. With future-ready architectures, manufacturers can broaden potential use cases across lines and supply chains.
AI in Manufacturing: Real-World Applications, Benefits, and Trends
Implement predictive maintenance now to eliminate costly downtime and save money in manufacturing. Deploy edge sensors and centralized analytics to monitor vibration, temperature, and lubrication, triggering alerts before failures occur.
AI-driven quality inspection relies on vision systems to analyze images from every unit on the line, cutting errors and scrap. In cases analyzed by manufacturers, defect rates fell by double digits.
Optimization supports production scheduling, maintenance windows, and inventory management in manufacturing, improving order throughput and reducing waste.
Programmable automation and digital twins enable simulation of changes, validation with data, and scaling of improvements without disrupting lines.
Across the supply chains, AI-enabled demand forecasting and chain optimization align production with customer needs, reducing costly overproduction in billion-dollar operations despite upfront investment.
These efforts rely on disciplined data management, clear labeling, and continuous learning from field data; data analyzed across cases shows energy and material savings. For certain use cases, ROI materializes in weeks.
Choose a high-value use case like predictive maintenance or automated inspections, prepare clean data, deploy modular AI with programmable controls, and track money saved and errors reduced.
In the near term, learning-based optimization, edge AI, and robust data governance will shape the field across technologies and chains.
Measure ROI with concrete metrics: uptime, scrap rate, energy per unit, and order fulfillment time.
Predictive Maintenance: Reducing Downtime and Extending Asset Life
First, launch a sensor-driven predictive maintenance pilot on your high volume assets to cut downtime by 30–50% and extend asset life. Install vibration, temperature, and oil-quality sensors, then feed signals into a centralized analytics platform to predict remaining useful life before a failure disrupts operations. This work helps the field crew and internal service teams act with precision, turning real-time data into actionable steps.
Connect predictions to maintenance workflows so each signal becomes a work order, parts are stocked for the main line, and teams talk with operators to adjust the production plan. Use diagnostic tools that combine asset history, environmental conditions, and process parameters to reduce false positives and build trust in the model, especially for teams needing rapid decision-making.
ROI is tangible: powered by artificial intelligence, pilot deployments show uptime improvements of 30–60%, MTBF rises, MTTR falls, and maintenance costs drop 15–25%. For the primary line, this translates to fewer emergency repairs, smoother shifts, and better service levels across the plant.
In cases across industries such as automotive, electronics, food and beverage, and consumer goods, predictive maintenance is becoming a mainstay for protecting production and reducing the risk to disrupt supply chains when failures hit. It becomes a main component of daily operations.
Robots and automated lines rely on precise predictions; the heart of uptime strategy is the analytic layer that turns sensor data into reliable actions.
To protect the body of your operations, define a single data body for governance, calibrate sensors consistently, and set internal ownership for data quality and access control. Even with noisy data and varying conditions, maintain reliability by standardizing data governance and clear ownership.
Key tools include vibration analysis, thermography, oil analysis, ultrasound, and ML-based anomaly detection; think of a field-tested toolkit that can adapt across asset families and the process lifecycle.
Plan a 90‑day phased rollout on 2–3 asset families, train their operators, and align with service providers to bridge skill gaps. Define KPIs: uptime, MTBF, MTTR, and maintenance cost per unit of output; track the volume of alerts versus true faults to tune the model, improving the signal for those needing reliable guidance.
For internal teams, run a knowledge transfer program so the field workforce understands how to interpret predictions and schedule work; their feedback loops improve model accuracy as operating conditions change. Approach with cross-functional governance to avoid silos.
Scale the approach across main asset classes, maintain a living dashboard, and refresh models as wear patterns evolve and volume grows. Regular data quality audits help ensure better asset life and reliability.
Quality Assurance with AI-Driven Visual Inspection
Deploy artificial intelligence-powered visual inspection on the production line to replace a portion of manual checks and speed up defect detection. Use high-resolution cameras, controlled lighting, and equipment close to the line to deliver working evaluation at the edge. This setup lets operators focus on exceptions while the system handles routine checks across various product variants.
In surveyed facilities, AI-driven inspection achieves defect detection rates of 95–99% for surface and dimensional faults, with false positives below 5% when the model is trained on diverse field conditions and product types. Throughput on lines with stable lighting improves by 20–40%, and rework costs drop by 15–25%, making the investment worth it for high-volume production. Inventory accuracy also rises as defects are tagged automatically and linked to lot information.
Key actions to implement include: define evaluation criteria for critical features; collect and label data representing various product variants and field conditions; calibrate lighting and camera settings to reduce shadowing on edge features; train the model with diverse samples and validate on a hold-out set to prevent drift; integrate inspection results with MES/WMS so flagged items trigger automatic inventory updates and work orders. As AI adoption becomes more widespread, teams will need to invest in ongoing training and data collection.
The role of the quality team shifts toward model maintenance, root-cause analysis, and handling exceptions. Inspectors review AI flags, adjust thresholds, and gather information to improve the training set. Although automation helps, human oversight remains essential for rare defects and edge cases. They believe a collaborative approach–where operators provide feedback and engineers tune the model–delivers the most reliable results.
Common challenges include drift from material changes or lighting variations, camera misalignment, and inconsistent labeling. To mitigate, implement continuous monitoring dashboards, schedule periodic re-training with newly surveyed data, and keep a manual fallback on critical items during the transition. This approach supports becoming more predictable in quality outcomes and reduces risk for production teams.
Begin with a pilot on a high-volume, low-variance line to establish baseline metrics, then leverage the learnings to scale to other lines and product families. Thanks to automation, teams can take more information-driven decisions, reallocate some tasks and spend less time on repetitive checks. This approach helps the inventory, equipment, and production teams work together to raise product quality across the portfolio.
AI-Powered Demand Forecasting and Inventory Optimization
Implement an AI-powered demand forecasting and inventory optimization loop now to save working capital, improve service levels, and reduce stockouts within the year.
Use an ensemble of algorithms to analyze internal information and external signals, then translate forecast signals into actionable orders and replenishment plans for most SKUs.
Within this approach, start by clarifying business objectives, selecting key metrics, and aligning IT prerequisites so the model can operate across parts of the supply chain around manufacturing sites, distribution centers, and suppliers.
- Data prerequisites and foundations: integrate ERP, MES, and CRM data with external feeds (seasonality, promotions, holidays, macro indicators). Clean, normalized data and clear lineage enable the algorithm to analyze patterns with high fidelity.
- Forecasting approach: deploy a mix of time-series models (seasonality and trend capture), machine-learning regressors, and demand-sensing techniques. Use ensemble methods to reduce forecast error, then analyze which signals drive most improvements for each product family.
- Inventory optimization: convert forecast signals into replenishment quantities and safety-stock targets using linear or mixed-integer programming, rule-based constraints, and heuristic adjustments for service constraints. Take advantage of lead-time, capacity, and capacity-availability data to keep stock aligned with demand.
- Functions and automation: automate order quantities, reorder points, and allocation rules between plants and warehouses. Automations around allocation help prioritize scarce parts and ensure critical items stay available during disruptions.
- Capabilities and integration: link the optimization layer to procurement and production planning systems so forecasts flow back into purchasing orders, production schedules, and staffing plans. This back-and-forth loop improves responsiveness without manual bottlenecks.
- Human-in-the-loop checks: implement guardrails for exception handling, promotions, and new product introductions. Allow business teams to override recommendations when market signals differ from forecast signals to preserve flexibility.
Most gains come from tightening the linkage between demand signals and replenishment decisions. By analyzing historical information and promotions, the system can anticipate demand shifts and adjust reorder quantities rather than waiting for stockouts to occur.
- Define clear objectives: target service levels by SKU, minimize total cost, and reduce working-capital ties. Set realistic improvement bands for the first 12 months to validate ROI.
- Map data flows and prerequisites: confirm data availability, latency requirements, and governance. Establish a data lake or warehouse that can serve real-time insights to the forecasting and optimization engines.
- Choose modeling mix: start with a baseline statistical model and gradually add ML components. Use backtesting and cross-validation to compare models by product family and region.
- Run optimization with constraints: incorporate lead times, capacity limits, minimum order quantities, and service-level constraints. Calibrate costs for holding, shortage, and ordering to reflect business priorities.
- Operationalize and monitor: deploy in a sandbox first, then rollout across sites. Track forecast accuracy, inventory turns, stockouts, and fulfillment cycle times, adjusting models quarterly.
Quantified outcomes surface when this approach scales: most organizations report 15–30% reductions in safety stock and 20–40% fewer stockouts, while service levels improve meaningfully. Across a multi-site, multinational network, improvements can reach billion-dollar opportunities by lowering carrying costs and accelerating capital turnover.
- Product and region focus: group SKUs by demand pattern and supply risk to tailor forecasting granularity. For high-turn items, apply finer granularity (daily or hourly); for slow movers, weekly or monthly forecasts may suffice.
- Alternatives and contingencies: when data is sparse, rely more on hierarchical forecasting and domain knowledge from sales and operations teams. Use scenario planning to stress-test stock levels under peak demand or supply disruptions.
- Measurement and governance: track forecast accuracy (MAPE, MASE), stockout rate, inventory days of supply, and service-level attainment. Report improvements by business unit and region to guide ongoing investments.
Take advantage of the efficiency gains by adopting a phased rollout: begin with high-impact categories, expand to adjacent parts, and continuously tighten the loop with feedback from service teams. The result is a repeatable, scalable capability that strengthens your business intelligence, enables proactive replenishment, and builds resilient operations around demand dynamics.
Smart Production Scheduling and Throughput Improvement
Implement real-time AI-powered production scheduling to maximize throughput and reduce costly downtime. By connecting equipment sensors, MES, and ERP, a unified data context lets the scheduler assign work to machines in seconds, align setups, and push decisions to the shop floor without waiting for human approval. The power of artificial intelligence enables faster response to disturbances and curtails frequent failures that stall lines, saving valuable time and improving product flow.
Before you deploy, run a controlled evaluation on a single line. Collect baseline metrics such as cycle time, idle time, and yield, then compare against a three-month pilot where real-time scheduling adjusts sequences, repairs, and changeovers as conditions change. In this context, maintain a clear target: reduce average setup time by 15-25%, lower downtime by 10-20%, and lift overall throughput by 10-18% on the chosen line; such improvements translate to lower cost per unit and a higher manufacturer margin.
To implement, start with a lightweight model that talks with operators and planners. Use data from equipment feedback, production calendars, and quality checks to plan in real time and to accurately reflect constraints. The approach should adapt after each run, learning from near-misses and small failures to refine scheduling rules. In practice, this reduces times when lines stall, keeps products moving through bottlenecks, and minimizes human intervention while sustaining human oversight for exception handling.
For the manufacturer, the payoff is measurable: cost reductions from labor reallocation, less overtime, and longer equipment life due to smoother load. With a robust real-time system, you can compare before/after results, tune schedules on a weekly basis, and track improvements in on-time delivery, defect rate, and output. The outcome is an efficient operation that preserves capacity and margins, while giving operators more time to talk about improvement initiatives rather than firefighting schedules. The goal is to deliver more accurate, repeatable products while avoiding unnecessary waste and inventory.
IoT, Edge AI, and Real-Time Shop Floor Analytics
Install IoT gateways and edge AI at the machine level to cut latency and keep sensitive production data local; compare cloud-based analytics only when needed to scale, and use programmable sensors to feed a live dashboard that shows cycle time, defect rate, and uptime in real time.
IoT networks enable a cross-machine view for the manufacturer and its partner ecosystem, generating data around energy use, vibration, temperature, and line stoppages. Real-time analytics uncover potential process optimizations and help management teams act within minutes rather than hours. This approach is disrupting traditional batch-oriented routines by turning observations into immediate actions on the floor, making the data useful for operators and engineers alike.
Edge AI runs where the data is generated to create a fast feedback loop that supports whether the next operation passes quality gates. It reduces backhaul traffic to the cloud and improves reliability on the shop floor. Edge processing yields results faster than sending everything upstream, which makes the process more resilient in environments with intermittent connectivity.
In industries across manufacturing, the combination of IoT, Edge AI, and real-time analytics creates a foundation for continuous improvement around the production line. For a manufacturer, these capabilities translate into faster time-to-value, governance of process data, and new offerings for customers in the future.
To scale, standardize data definitions and establish a partner network that supports interoperability across devices and ERP/SCM systems; programmable interfaces and APIs let the system generate actionable insights, from scrap reduction to throughput gains.
The real-time analytics layer plugs into the digital management stack, connecting sensors to dashboards and alerts, and providing a back-end data feed for optimization engines that push decisions back to the line, whether to slow or accelerate a process, or to adjust a programmable controller.
By correlating machine health with production cycles, plants can schedule maintenance before failures disrupt output, reducing unplanned downtime and improving overall equipment effectiveness (OEE) without heavy capital spend.
The most impactful gains come from closing the loop: collect data, analyze in real time, and push optimizations back to the line, creating a closed-loop that scales as you add more machines and sites.