


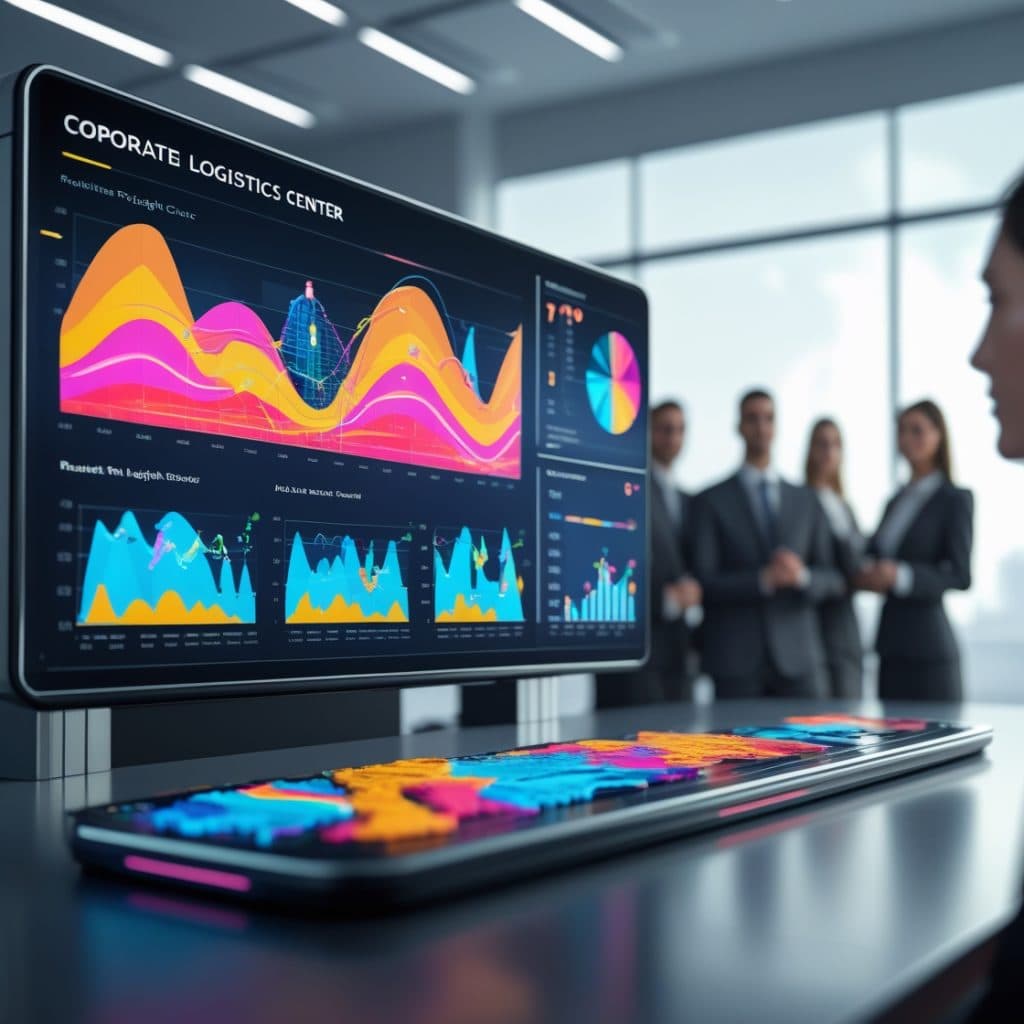
Freight operations produce enormous volumes of raw data every day, and most of it sits unused in spreadsheets or siloed TMS exports. In our experience coordinating carriers across multiple trade lanes at GetTransport.com, the difference between a logistics team that reacts to problems and one that prevents them almost always comes down to how well they visualize what their data is actually telling them. Freight data visualization tools turn that raw operational output into something a planner or executive can act on, supporting sharper freight performance tracking, more disciplined freight carrier analytics, and cleaner end-to-end logistics data analytics.
Why Freight Data Visualization Matters
Freight operations generate large amounts of data, covering carrier performance, capacity utilization, shipment tracking, and more. Converting that data into visual form matters because it enables teams to:
- Spot bottlenecks and inefficiencies before they compound
- Analyze freight KPIs in real time rather than after the fact
- Forecast capacity requirements and utilization patterns
- Compare carrier performance objectively to sharpen selection decisions
- Produce freight reporting tools that stakeholders across the business can actually read and trust
Without visualization, logistics teams tend to make decisions on incomplete or stale data, which drives up costs and erodes service levels. We see this repeatedly when onboarding clients who have been managing freight by gut feel and weekly email summaries.
Key Features to Look for in Freight Data Visualization Solutions
When evaluating freight data visualization solutions, look for platforms that offer:
- Interactive dashboards: Customizable screens built around the freight KPIs that matter to your operation
- Real-time data integration: Clean, reliable syncing with TMS, ERP, and other logistics systems
- Advanced analytics: Forecasting for capacity, carrier performance, and cost exposure
- Scalability: The ability to handle growing data volumes as the enterprise expands
- User-friendly interfaces: Accessible to both technical analysts and operations managers who have no interest in writing queries
- Collaboration features: Shared dashboards and reports that keep commercial, planning, and operations teams aligned
Best Freight Data Visualization Tools for Enterprises
1. Power BI (Microsoft)
Power BI is a widely adopted business intelligence platform that translates well to logistics data analysis. It offers:
- Configurable freight KPI dashboards built to your own metric definitions
- Connections to a broad range of data sources, including freight analytics software
- Drill-down and slicing capabilities for freight carrier analytics and shipment-level analysis
- Automated reporting with scheduled email distribution
That flexibility makes it a practical choice for enterprises that want to build out freight reporting tools with sophisticated visualization on top of data they already own.
2. Tableau
Tableau's reputation rests on its drag-and-drop interface and the visual quality of the dashboards it produces. For freight teams, the practical benefits include:
- Real-time monitoring of freight performance across lanes and carriers
- Straightforward blending of disparate data sets, including freight capacity analysis and carrier records
- Mobile-accessible dashboards for managers who spend time in warehouses or on the road
- A strong user community and a good selection of freight-specific templates
In our experience working with mid-size shippers, Tableau tends to surface trends and anomalies that would otherwise take an analyst hours to find manually.
3. Looker (Google Cloud)
Looker takes a data-modeling-first approach that suits enterprises building structured freight analytics environments. Key capabilities include:
- Governed data modeling tailored for freight capacity analytics and carrier analysis
- Native integration with cloud data warehouses and freight analytics solutions
- Customizable visualizations tracking KPIs such as on-time delivery and cost per shipment
- Embedded analytics that push freight data visualization into other enterprise applications
Looker works well for organizations that need a single, trusted version of freight data drawn from multiple source systems.
4. GetTransport Analytics Suite
Many general-purpose visualization tools require significant configuration before they are useful for freight. The GetTransport Analytics Suite is built specifically around logistics workflows, which shortens that path considerably. It provides:
- Dedicated freight carrier analytics and capacity analysis built into the core product
- Pre-built freight KPI dashboards aligned to standard industry metrics, so teams are not starting from a blank canvas
- Real-time freight performance tracking designed to reduce delays and control costs
- An interface built for logistics managers, not data engineers
Because the platform is grounded in freight sector knowledge, companies can visualize their freight data and accelerate decision-making without a steep learning curve.
5. Qlik Sense
Qlik Sense is built around associative analytics, meaning users can explore freight data interactively without being constrained by predefined query paths. Its core strengths include:
- Self-service analytics that logistics teams can run independently
- Support for complex data models covering freight reporting and capacity analysis
- Strong visual storytelling for communicating freight trends to senior stakeholders
- Solid security and governance controls for enterprise environments
Qlik Sense tends to surface connections in freight data that conventional static reports miss entirely.
Most Important Freight KPIs to Visualize
To get real value from freight data visualization tools, teams need to track the right indicators. The ones that matter most in day-to-day operations include:
- On-time delivery rate: The clearest signal of carrier reliability
- Freight cost per unit: Tracks cost efficiency at the shipment level
- Load utilization: Measures how effectively freight capacity is being used
- Transit time variability: Identifies inconsistency in carrier schedules
- Carrier performance score: An aggregate measure for ongoing carrier rating
- Freight claims ratio: Flags damage or loss patterns before they become systemic
- Freight capacity utilization: Highlights underused or overbooked assets
When we arrange cross-border loads for SMBs, we see that teams who track these KPIs on a live dashboard catch service failures days earlier than those relying on end-of-week reports. That gap in response time has a real cost. FreightWaves has documented broadly how visibility gaps translate into operational losses across carrier networks, and the pattern holds at the individual shipper level too.
Freight Data Visualization Implementation Best Practices
- Set clear goals: Align visualization objectives with specific business priorities, whether that is cost reduction, service improvement, or carrier accountability
- Integrate data sources: Pull from TMS, ERP, and external carrier feeds to build a complete picture rather than a partial one
- Tailor dashboards by role: Executives, planners, and operations staff need different views of the same underlying data
- Train users: Ensure that the people who need to act on visualized information can actually read and interpret it
- Iterate continuously: Refine dashboards based on user feedback and shifting operational priorities
Following these steps gives companies a freight analytics environment that produces measurable impact rather than attractive charts that nobody checks. Gartner has noted broadly that analytics adoption in supply chain settings stalls when tools are not matched to the actual workflows of the people using them, and freight is no exception.
Conclusion
Freight data visualization tools are no longer optional for enterprises that want to get real value from their freight data. From interactive KPI dashboards to precise freight performance monitoring, the right platform turns complex operational data into clear, actionable insight. Tools like Power BI, Tableau, and the GetTransport Analytics Suite each bring a distinct approach to integrating freight carrier analytics and capacity data into a single view.
Choosing the right freight data visualization solution gives logistics managers the foundation to improve operational efficiency, reduce costs, and make better decisions in a freight market that rewards preparation over reaction.
FAQ
Q1: What is a freight analytics platform?
A freight analytics platform collects data from freight operations and analyzes it to provide insights on shipment performance, costs, and carrier reliability.
Q2: How does freight data visualization improve decision-making?
Visualization distills complex data into an interpretable format, making it easier for logistics managers to identify trends, spot outliers, and find optimization opportunities.
Q3: Are freight data visualization tools integratable with current logistics systems?
Yes. Most modern tools support integration with TMS, ERP, and other freight analytics platforms to deliver real-time, consolidated data views.
Q4: What KPIs are most important for freight performance monitoring?
On-time delivery rate, freight cost per unit, load utilization, transit time variability, and carrier performance scores are among the most critical KPIs to track.