

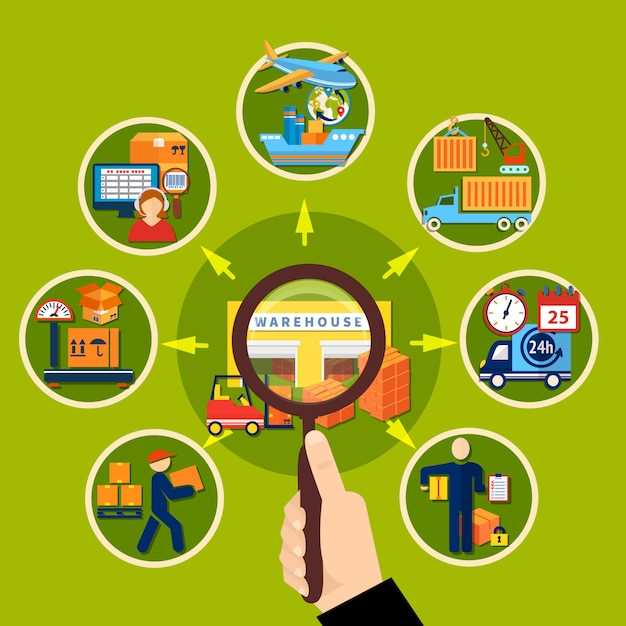
 Top 10 Trends Shaping the Future of Supply Chain Management">

Recommendation: サプライヤー、工場、物流パートナー全体でデータを標準化し、最前線のチームにライブダッシュボードを提供することから始めましょう。統一されたデータ、クラウド аналитика、エッジ対応センサーというこの設定全体により、意思決定サイクルが短縮され、在庫レベルが調整され、ネットワーク全体のサービスが向上すると同時に、リアルタイムでパフォーマンスを監視できます。.
トレンド 1: リアルタイムでの可視性は、ネットワークのすべてのノードにセンサーが情報を送り込むにつれて必須となり、受動的な意思決定から能動的な意思決定への移行を可能にします。初期の試験運用では、在庫切れが15〜25%減少し、混乱発生時の対応が10〜20%迅速化されたと報告されています。.
トレンド 2: レジリエンスとリスク管理は計画に組み込まれています。コスト管理の目標とは別に、サプライヤーの集中に関する懸念はシナリオベースのバッファーと多様化された調達を促し、事業を麻痺させることなくショックを吸収するのに役立ちます。難しいのは、どこでバッファーが最も重要なのかを優先順位付けすることです。.
トレンド 3: 自動化とAIのリフト operations ルーチンタスクの処理、納期回答の精度向上、現場担当者の例外処理対応時間確保などにより、インバウンドロジスティクスでは、精度が25%以上向上し、データ入力作業が約60%削減されます。.
トレンド 4: 高度な分析と需要予測は、内部データと外部シグナルを融合させ、リーチを拡大し、予測の品質を向上させます。組み込みのガードレールにより、過剰適合を回避し、モデルと意思決定に対する適切なガバナンスを維持できます。.
トレンド 5: 持続可能性と責任あるロジスティクスは、コスト削減とリスク軽減を推進します。ルート最適化の改善は燃料消費量とアイドリング時間を削減し、センサーはデリケートな商品の状態を検証し、新たな規制要件への対応を支援します。.
強靭なサプライヤーネットワーク:マルチソーシング戦略、サプライヤーリスクスコアリング
Adopt a マルチソーシング 重要なコンポーネントのフレームワーク:品目ごとに安全な2~3社の交換可能なサプライヤーを確保し、サプライヤーリスクスコアリングプロセスを四半期ごとに実施する。このアプローチは直接的に削減に繋がる。 不足 混乱時の供給を確保し、今後の注文に関する取引条件を改善します。.
コアネットワーク向けの実用的なリスクスコアリングモデルを、5つの基準で構築します。 財務の健全性, capacity, 納期遵守率, qualityそして compliance. ウェイトを割り当て、明確な閾値を設定し、スコアが基準値を下回った場合にサプライヤー育成を促します。堅牢なスコアは、適切なサプライヤーを選択し、サプライチェーン全体のリスクエクスポージャーを軽減するのに役立ちます。.
組織的な整合性は重要です。調達、オペレーション、リスク、財務のオーナーシップを含む業績指標に関するガバナンス・ケイデンスを構築し、ERPとサプライヤーポータルを統合し、リスクスコア、支出集中度、代替品の有効化までの時間を示す月次ダッシュボードを公開します。この構造により、組織は迅速に対応し、ネットワーク全体のパフォーマンスを管理できます。.
交渉する カスタマイズされた コストとレジリエンスのバランスを取るための条件:柔軟なSLA、価格カラー、およびキャパシティバッファ。検証する。 environmentally 標準を定め、サプライヤーのスコアカードの一部としてESGデータを要求します。 ニッチ サプライヤーはそれぞれが専門的な能力を提供しており、リスクが急増した際にギャップを埋めるために市場で広く利用されています。既存の供給を中断することなくキャパシティを確保できるよう、今後締結する契約に関する取引の流れをさらに構築してください。.
市場インテリジェンスと継続的改善:継続的に維持 research サプライヤーについて、今後の規制変更やサプライヤーの財務状況を監視し、リスク台帳全体を維持し、シナリオプランニングを使用して供給ショックをモデル化し、キャプチャします。 opportunities 支出を多様な供給源に向けて再調整すること。このアプローチは強化します。 supply 回復力を高め、業界全体で価値を創造します。 supply チェーン.
エンドツーエンドの可視化のためのデジタル化:デジタルツイン、リアルタイムダッシュボード、予測分析
まず、特定の製品ファミリーのデジタルツインを導入し、90日以内にエンドツーエンドの可視性を獲得します。ERP、WMS、TMS、サプライヤーポータルからのライブデータを接続し、ツインは在庫、生産、輸送フローをモデル化し、需要の急増、サプライヤーの遅延、品質不良などのイベントで更新され、現実世界での使用に適した状態を維持します。このアプローチにより、チームは意思決定において遅れを取りにくくなり、顧客が信頼できる透明性が構築されます。このアプローチは、組織および組織レベル全体でメリットをもたらすと考えています。AdBlueの在庫などのテストケースは、予測の精度を検証し、真の価値を実証します。チームは、ツインをライブダッシュボードと組み合わせることで、死角が減り、洞察から行動への転換が加速することを発見しました。常に、バリュークリエーションと、チェーン全体での測定可能な改善に焦点を当ててください。.
リアルタイムダッシュボードは、組織や組織の境界を越えてメトリクスを表示し、サプライヤー、製造、ロジスティクス、顧客からのデータを統合します。予測の正確性、納期厳守、在庫状況、配送の信頼性を強調し、経営陣がどこで行動すべきかを確認できるようにします。ダッシュボードは、計画、実行、および顧客サービス間の関連性の理解もサポートし、無駄を削減し利益を向上させるアクションを可能にします。これらの使用法は、顧客とサプライヤーとの相互に透明性の高い関係を可能にし、信頼とコラボレーションを強化します。.
予測分析は、過去のパターンを将来を見据えた洞察へと転換させます。モデルは、需要の変動、リードタイムのばらつき、および中断の可能性を評価し、イベントをシミュレートして対応オプションを比較します。その出力は具体的なアクションとなり、在庫バッファ、サプライヤー契約、および輸送手段の選択を導きます。人間チームと機械のこの連携は、透明性と信頼性を高め、自信を持って次の混乱に対処し、社会への影響を最小限に抑えることを容易にします。.
Implementation steps
- スコープとガバナンスを経営陣とともに定義し、データオーナーを任命し、相互説明責任を確保するための部門横断的なルールを設定する。データ品質と組織目標および機構目標との整合性を確保する。.
- トップデータストリーム(ERP、WMS、TMS、サプライヤーポータル)を接続し、いくつかのイベントに対して調整することで、デジタルツインを構築します。モデルがスケーラブルであり、需要の変化によく適合するようにしてください。.
- チェーン全体にわたる重要なKPIを表面化するリアルタイムダッシュボードを導入する。チームをトレーニングし、ユーザーが明確で実行可能な洞察にアクセスできるようにする。計画、実行、および顧客サービスに及ぶ用途を含める。.
- 予測分析を実行し、予測を検証し、混乱シナリオに対する仮説シナリオを実装する。洞察を具体的な行動に変換するプレーブックを確立する。計画担当者の思考が価値と次に取るべき最善のステップに集中し続けるようにする。.
- 新たな能力を制度化する:計画と実行プロセスに組み込み、組織学習を促進し、顧客やパートナーと連携して、持続的な利益を確保する。.
利点と指標
- より優れた計画とイベントへの迅速な対応により、サイクルタイムと在庫保管コストを15~25%削減。サービスレベルが向上するにつれて利益も増加。.
- エンドツーエンドの可視性とデータ品質の向上により、予測精度を10~20%、納期遵守率を5~15%向上。.
- 顧客とサプライヤーとの透明性を高め、信頼と協調を強化することで、利害関係者がタイムリーな情報を共有することで、社会への混乱の影響を軽減できます。.
- ネットワーク内のノード間の理解を深め、特定の障害から得られた教訓を活用してモデルとアクションを洗練する。.
- 経営陣および組織のリーダーシップに対し、デジタル化の価値を実証し、技術と人材へのさらなる投資を促進する。次期予算の決定を正当化するためのデータに基づいた証拠を示す。.
ニアショアリングと地域ハブ:現地調達、地域製造、貿易圏のメリット、サプライヤー・エコシステムの強化
地域的なハブモデルを採用し、地域調達とモジュール製造を組み合わせ、共有された プラットフォーム 了解しました。 intelligence サプライヤー、キャパシティ、および市場全体のパフォーマンスについて。これ プラットフォーム より迅速な対応を可能にします。 インフレーション そして上昇 prices, 、それを超えると、柔軟性と回復力が得られ、 green 対象範囲内のエネルギーオプション。.
ニアマーケットソーシング、地域製造クラスター、合理化された貿易ゾーンプロセスという3層アプローチを実装します。このアプローチは、 existing サプライヤーネットワーク、を追加 イネーブラー ローカルな物流拠点のように、双方向性を強化します。 インタラクションズ サプライヤーとの連携。主要市場の近くで調達を集中させることで、 less 混乱へのエクスポージャー、削減 electric 電力使用量を削減し、リードタイムを短縮します。一部のセクターでは、, projected 配送速度が20%~40%向上し、 prices 安定性。.
サプライヤーのエコシステムを、以下と連携させることで強化します。 green エネルギー供給事業者、地域配電拠点、および明確なガバナンスモデル。 system サポートする必要があります development より小規模な地域企業のシェアを拡大し、 manufacturing 、ゾーン内のキャパシティを確保し、遠隔地のサプライヤーへの依存を軽減する必要があります。対応すべきは、 care ショック発生時のリスク管理。計画にはサプライヤーを盛り込むこと。 インタラクションズ 顧客との間、そしてクラスターネットワーク内で関係を構築することです。潜在的に、これによりあなたの会社はより広範で信頼できるパートナー基盤を得て、レジリエンスを向上させることができます。.
実装手順:map existing サプライヤー、ギャップの特定、リーンなオペレーションによる地域ハブの設立、共有への投資 プラットフォーム 調達、品質データ、サプライヤー育成のため、貿易地域内で関税に有利な規則を交渉し、地域の公益企業と連携して確保する。 electric 安定した価格で電力を供給し、 development 持続可能性と品質基準を満たすためのプログラム。このアプローチは、管理に役立ちます インフレーション リスクを軽減し、改善します。 performance 廃棄物の削減と市場投入までの時間短縮により、予想される削減額はセクターによって異なりますが、通常、着陸費の削減とサービス水準の向上などが含まれます。 required データガバナンスおよびクロスボーダー物流などの機能が含まれます。.
測定とガバナンス:追跡 relevant 納期遵守率、不良率、サプライヤーの対応力などのKPIを使用します。 system シナリオをシミュレートし、混乱に備えて計画を立てるため。以上 インタラクションズ パートナーと協力して、 care コンプライアンスとリスク管理において、重点を置く development 需要ピークや予期せぬショックに対処するための地域対応能力。.
政策アジリティと地政学的インテリジェンス:シナリオプランニング、政策モニタリング
パトリックをポリシー監視プレイブックのオーナーに任命し、規制の変化、制裁、および貿易管理に関するタイムリーなアラートを提供するためのクロスファンクショナルなチームを編成します。ポリシーシグナルを戦略にマッピングし、各シグナルを調達、生産、および流通全体の目標にリンクすることで、緊急の意識を醸成し、エグゼクティブダッシュボードにフィードし、すべてのシグナルをガバナンス要素の具体的な目標に結び付ける単一の情報源を構築します。.
複数のシステム(ERP、WMS、TMS、サプライヤーポータル、クラウドデータフィードなど)を接続し、計画担当者、購買担当者、顧客に遅滞なく情報が伝わるようにします。センサーやRFIDタグなどのデバイスを使用して、ポリシー主導の仮定を検証し、チームにリアルタイムデータを提供します。この高度な設定により、リスクに関するタイムリーなヒートマップが可能になり、データからアクションへの移行を加速できます。クラウド分析を活用して、回復力を強化します。.
シナリオプランニングのフレームワーク
4つのシナリオからなるファミリーを構築する:ベースライン、混乱重視、段階的正常化、そして政策引き締めリスク。関税変更、輸出規制、制裁、港湾閉鎖、通貨変動、気象ショック、そしてCOVID-19政策の変更を含むトリガーを定義する。リードタイム、生産能力、そしてコストへの影響を数値化し、各シナリオをサプライヤーの多様化、量のシフト、そして近隣拠点での生産能力構築のような具体的な行動に結び付ける。計画が廃棄物削減に取り組み、顧客へのサービスレベルを維持し、商品の流れを保護し、戦略的な在庫バッファーを維持することを保証する。.
ポリシー監視指標

アラートの適時性(目標:トリガーから24時間以内)、地理と商品によるカバレッジ、および重要サプライヤーの脆弱性スコアなどの指標を含む、ポリシーコックピットを確立します。天気、政治リスク、港湾のボトルネックを視覚化するためにヒートマップを使用し、フィードの品質をクラウドベースのダッシュボードに結び付け、迅速なクラウド・ツー・グラウンドのアクションを可能にします。週次のリスク概要、月次の深掘り、四半期ごとの目標との戦略整合および移行計画というケイデンスを作成します。無駄を減らし、サービスの信頼性を向上させるために、各分野に2人のオーナーを割り当て、公開されている目標リストに対して決定を記録する、軽量なガバナンスモデルを含めます。.
物流におけるサステナビリティとサーキュラリティ:ESG指標、カーボンアカウンティング、サーキュラーサプライチェーン
スコープ1~3をマッピングしてチェーン全体の排出量を把握し、2030年までにスコープ3の排出量を30%削減する目標を設定し、GHGプロトコルに沿ったカーボンアカウンティングを展開する。サプライヤーとのESGデータ共有フレームワークと、主要指標の進捗状況を追跡し、チームやパートナー間の意思決定と説明責任を促すダッシュボードを作成する。このフレームワークは、ステークホルダーや組織全体に進捗状況を共有するのに役立つ。.
組織全体およびサプライヤー間でESG指標を標準化するために、KPIを絞り込みます。例えば、製品ユニットあたりのGHG排出量、トンキロあたりのエネルギー使用量、水リスクへのエクスポージャー、廃棄物転換率などです。高いデータ品質を維持し、トレーサビリティを確保し、小売パートナーが業績を比較するためにアクセスできる共有形式で結果を公表します。小売エコシステムの一員であれば、進捗状況を確認したいはずです。.
パッケージと製品設計における循環性は重要です。分解を容易にする設計、モジュール式部品、および回収プログラムを展開してください。少なくとも5年間で、パッケージング材料の50%以上を再利用またはリサイクル可能にすることを目標とし、材料再利用率(MRR)と製品寿命終了時の回収率を測定してください。廃棄物を代替する価値を生み出す、新しい形に紡ぐことができるウールのような包装繊維について考えてください。.
物流における炭素会計では、輸送モード別およびルート別の排出量を明確に把握する必要があります。レーンごとの炭素予算を使用し、ルーティングを最適化し、積載を統合し、可能な場合は低排出モードに移行します。主要な SKU のライフサイクルアセスメント(LCA)を開発し、サプライヤーの排出量を把握し、調達の意思決定に役立てます。.
処理およびデータアーキテクチャにより、リアルタイムのインサイトが実現します。ソースでデータを収集し、統一されたデータレイクを構築し、データの品質を確保して精度を高めます。処理パイプラインと分析を使用して、ホットスポットを特定し、排出量を予測し、ネットワーク設計をオンザフライで調整することで、意思決定はデータに基づいたものになります。.
レジリエンスとインセンティブ:サーキュラリティはリスクを軽減し、ビジネス価値を創造します。適切なプログラムは、サプライヤーとの関係を強化し、サイクルタイムを改善し、廃棄物コストを削減します。透明性、タイムリーなデータ共有、継続的な改善を評価するサプライヤー・スコアカードを使用することで、組織はより長期的な視点と価値あるパートナーシップによって競争力を維持できます。.
まず、包装廃棄物の流れを把握し、2つの製品群でリバースロジスティクスの試験運用を行い、サービスコストの変化を定量化し、毎月の進捗状況を報告します。調達に関する決定をESG目標と一致させ、顧客や小売業者の期待に応え、成功した試験運用をサプライチェーン全体に拡大します。.
持続可能性と循環性が、単なる追加要素ではなく標準となるとき、かけがえのない利点が生まれます。ESG指標、カーボンアカウンティング、そして循環性を日常的な計画に組み込むことで、企業は品質、需要のシェア、そしてブランドへの信頼を強化すると同時に、サプライヤーとパートナーの長いサプライチェーン全体のリスクを軽減します。.