

 Will Autonomous Trucks Put the Iron Horse Out to Pasture? An Analysis of Trucking Automation">

Answer: launch a staged rollout of autonomous trucks onto high-volume corridors to protect profit and sharpen operation as you validate performance with pilot routes.
Data from welborn analytics show that driver costs, benefits, and insurance push line-haul costs upward; automation can reduce the time behind the wheel and cut idling, which lowers fuels and maintenance. The mountain of data from pilot runs helps fleets quantify ROI, and margins are undervalued when assets sit idle. If fleets target routes with steady, predictable demand, automation can deliver a durable uplift in profit almost immediately, without requiring a full-scale replacement of the fleet.
For operators, the decision hinges on ROI, not just hardware. theyre risk tolerances align with pilot reliability, and the calls from shippers remain strong on corridors with consistent demand. In controlled lanes, uptime has improved; time to schedule is shrunk, and ground crews can repurpose roles to maintenance and data analytics. If a carrier wants to keep moving, they should stop chasing perfect autonomy and start a measured program that blends automation with human oversight, especially on routes used by exporter in cross-border trade.
Operational design matters: automation works best when fleets align with fuels price cycles, use electrified or alternative-fuel solutions, and consolidate routes to reduce empty miles, without being disruptive. The strategy favors a mix of long-haul automation and regional human-led operations, enabling ground teams to manage maintenance and software updates, while trucks operate in platoons that conserve fuel and improve safety. This approach keeps operators competitive and preserves jobs in support roles.
Bottom line: better resilience and profit come when automation augments the human operation rather than replacing it; fleets that pilot equipment without overshoot can maintain service levels for exporter and end customers, without sacrificing safety. The answer is not a binary yes or no: automation shifts the risk-reward curve and shortens time to scale, letting managers keep momentum while they test, adjust, and expand their networks onto new lanes.
Practical roadmap for fleets, regulators, and shippers facing automation hurdles
Recommendation: pursue a third track–governance–alongside pilot and scale. Implement a three-track rollout backed by a shared data pipeline and coreweaves analytics. In year one, run pilots on california corridors and another high-traffic route, measure speeds, braking, and collision avoidance, and translate those results into a value proposition for fleets and shippers. Offer a limited freebie to early adopters to accelerate learning while keeping downside risk manageable.
Fleets should build readiness by deploying smart sensors, standardizing data formats, and signing data-sharing agreements with suppliers. Create a staged adoption plan that keeps driver roles intact where safe and expands automation where speeds are stable. Mostly incremental upgrades should occur, with clear KPIs: haul time reduction, predictive maintenance, and improved on-time delivery. Having a tight change-control process reduces risk and protects the customer promise. Use harbo corridor pilots to calibrate loading patterns and dock operations. Be mindful that gains can be fleeting; design metrics to sustain throughput over year two. If results show improvement again in the next quarter, scale.
Regulators should require a formal safety case with scenario testing and third-party audits, plus dashboards that drive accountability. Establish an advisor panel to guide policy updates and weigh the impact on road safety. Set predictable timelines to avoid bottlenecks that stall investment. Monitor crash data and near-miss reports, align insurance models so premiums reflect actual risk, and publish behind-the-scenes summaries to inform stakeholders. This approach anchors trust and avoids an unplanned disruption.
Shippers should align contracts around transparent SLAs, risk-sharing terms, and shared KPIs for reliability and energy efficiency. Use a value-based pricing model that ties incentives to verifiable outcomes. Offer a freebie or pilot discount to accelerate adoption and build the pipeline of data those managers need. Track haul performance and set expectations that growth will be gradual but steady; that leads to a mostly smooth transition and reduces trailing delays in multi-stop networks. The article generated a practical playbook for ongoing collaboration between carriers, brokers, and manufacturers. Growing data streams from sensors inform dynamic routing decisions and justify continued collaboration with suppliers. For shippers, that means partnering with carriers that can deliver ongoing savings thats visible in quarterly reports. That is the core value advisor would offer to supply chain teams.
| アクション | Owner | タイムライン | メートル |
| Launch pilots on california corridors and harbo lanes | Fleets + Regulators | 1年目 | On-time haul rate, safety score |
| Establish data-sharing agreements and coreweaves pipeline | Fleets, Suppliers, Tech Partners | Q1–Q2 | Data completeness, pipeline throughput |
| Publish formal safety-case requirements and audits | 規制当局 | Q2–Q3 | Audit pass rate, compliance time |
| Align insurance models and premiums with measured risk | Carriers, Insurers | 1~2年目 | Premium adjustments, risk-adjusted costs |
| Finalize SLAs and value-based contracts with shippers | Shippers, Carriers | 進行中 | Service reliability, savings realized |
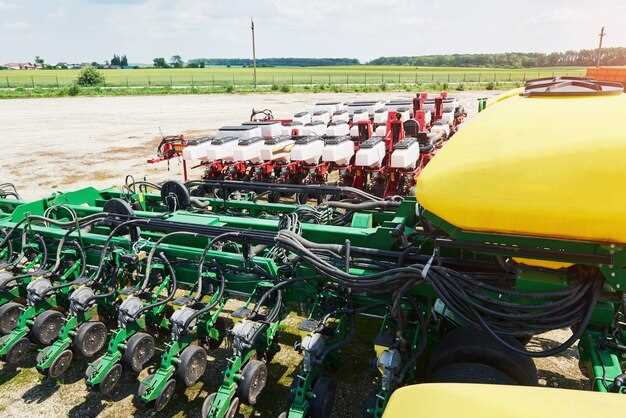
Current capabilities and limits of autonomous trucks on mainline routes
Recommendation: operate autonomous trucks on geofenced mainline corridors with continuous remote monitoring, a standing safety observer in the truck during early pilots, and a staged ramp-up tied to explicit milestones and disclosure to stakeholders.
On long, straight, well‑marked freeways, autonomous trucks currently maintain lane position, adapt speed to traffic, and execute routine merges with minimal human input. They can carry out standard exit maneuvers when a clear view and reliable map data exist, and a second operator is ready to take over if sensors detect an edge case. Platooning offers energy efficiency gains on these routes, while a safety‑monitoring layer keeps operations within approved performance envelopes. California‑based trials have demonstrated controlled movement on select corridors with measured on‑time performance and clear service level definitions, made possible by robust sensor suites and reliable communications.
Limitations appear where weather worsens, urban transitions begin, or construction zones complicate the geometry of the road. Edge cases, heavy traffic interchanges, and occlusion from bikes, pedestrians, or debris can trigger handovers to a human supervisor. Urban corridors and ramp-to-city transitions remain weak links; the system is highway‑first and requires a second driver or remote operator for many tricky situations. Weather, road surface conditions, and cybersecurity risks also constrain the reliability envelope and can disrupt ongoing operations.
Operations demand disciplined dispatch, maintenance, and disclosure. A single failure can disrupt a chain that touches port throughput, manufacturing, and retail delivery. An agreed safety case and standard operating procedures guide when to hand control to a human, when to pause for weather, and when to halt trips for inspections. The railroad case shows intermodal disruption can shift volumes to rail when trucks cannot run; authorities and customers expect clear letter of intent detailing expected service levels. If youd review the data, youd see how uptime, maintenance windows, and incident reporting shape trust in the program.
Economic dynamics influence decisions: the price per mile for autonomous operations remains higher in several markets due to equipment costs and ongoing supervision, but demand for capacity and driver shortages can push outcomes toward a favorable breakpoint as volumes grow. Good strategies align with existing trades and logistics flows, especially where intermodal links exist–urban corridors that connect with hubs can carry higher value when paired with rail shipments. Disclosure about reliability, maintenance windows, and contingency plans helps set realistic expectations and reduces trouble with customers. In California and Europe, pilots pursue a staged path that could lower price per mile as hardware costs fall and software matures, making the case for incremental gains that will carry through to broader deployments and long‑term ROI.
Anthony notes that the biggest gains come from lanes with stable traffic and clear weather, where the force of automation can form a predictable operating form. The stakes are high for a company that moves goods by trains and trucks, and the integration with railroad and intermodal partners shapes overall impact and disruption risk. Agreed, a measured expansion–with transparent disclosure and formal letters of intent–helps manage expectations and keeps urban and suburban corridors from becoming troubled ground. These conditions will not replace all drivers today, but they will shape steady progress on mainline routes while urban tests continue to refine the second‑phase capabilities and intermodal coordination needed for broader value.
Costs, financing, and return considerations for fleet automation
Phase a pilot with a clearly defined ROI target and lock in performance-based financing to align costs with realized gains.
Costs break into capital expenditure (capex) and ongoing operating expenses (opex). Capex covers the build of the automation stack–sensors, computing, perception software, actuators, and the integration layer with fleet management and ERP systems–plus installation and commissioning. Including integration with existing workflows, capex per vehicle typically ranges from 140k to 250k for a mid‑level kit, with higher figures for retrofit into older trucks or for more advanced autonomy levels. Averaged across a fleet, the upfront hit will depend on whether you’re building new units or upgrading existing stock, and on the complexity of route profiles. The production timeline for a phased rollout stays tight: a pilot may take 3–6 months, while full deployment can run 12–24 months depending on scale and supplier readiness.
Opex covers software subscriptions, cybersecurity, data services, maintenance, tire wear optimization, and driver retraining. Expect 8k–12k per vehicle per year in ongoing costs at scale, trending down as uptime improves and renewal cycles consolidate. There remains a margin between the cost of the automation system and the savings it delivers, driven by utilization and the quality of data integration. A well‑designed program reduces the cost of ownership over five years by shifting a portion of maintenance and fuel spend into predictable, line‑item savings.
Capacity gains come from higher uptime and better asset utilization, enabling bulk moves and longer-haul lanes that were previously constrained by driver fatigue rules. For an exporter with dispersed operations, the ability to carry higher payloads safely and reliably can reduce the “pocket” of inefficiency in regional markets. In practice, the improvement in capacity can push utilization from 70% to 85%–90% over time, with bigger effects on long‑haul and high‑density corridors. If demand spikes or volumes crash, the program must adapt quickly;荒 when volumes slump, payback slows unless SLAs and fuel-saving provisions protect the economics. This risk underscores the need for outside contingencies and a well‑stocked spare‑parts plan.
Financing options tailor capex timing to your cash flow. A phased approach works well, starting with a pilot funded through a mix of cash and equipment leases, then scaling with manufacturer or third‑party financing tied to performance. Options include:
- Direct ownership financed with a term loan, leveraging predictable fuel and maintenance savings to justify the debt service.
- Operating leases or finance leases that keep the automation assets off the balance sheet while preserving tax and renewal flexibility.
- True leases with a residual value, suitable for fleets that want to refresh technology every few years without large upfront outlays.
- Sale-leaseback arrangements for fleets with excess idle assets or for funding strategic upgrades without diverting working capital.
- Performance-based contracts with suppliers that release payments when uptime, fuel savings, or safety metrics hit targets, aligning risk with realized gains.
- Grants or incentives where available, plus tax credits or depreciation benefits that improve after‑tax economics.
Financing strategy should consider a “pocket of capital” for contingency repairs and quick replacements, since spare parts and integration support can vary by region. Partnering with vendors that offer bundled services–maintenance, over‑the‑air updates, and on‑site support–helps stabilize opex. In markets with volatile demand, a blended approach using capital and non‑capital financing keeps cash flow healthier and reduces the chance of a doom scenario where a single volume shock derails the plan.
Return considerations hinge on both financial and operational metrics. Financially, aim for a payback window of 2–5 years depending on mileage intensity and route complexity. An average IRR target in mature fleets ranges from the mid-teens to the low‑twenties when utilization is high and maintenance costs decline with automation maturity. Be sure to model a five‑year horizon to capture depreciation, tax shields, and renewal costs. Non‑financial returns–such as reductions in driver fatigue, improved safety, and more consistent service levels–support higher customer retention and potential premium pricing for reliable service.
Key performance indicators (KPIs) to track include total cost of ownership (TCO), fuel per mile, maintenance spend per mile, fleet availability, and average miles per unit. Track crash rates, near‑miss events, and compliance with hours‑of‑service rules; even modest drops in incident rates can translate to meaningful insurance savings and lower downtime. Averaged across several deployments, users often see fuel savings in the range of 5%–15% and maintenance reductions of 10%–20% after the first year of steady operation, with further gains as data‑driven maintenance and tire planning mature. When the project aligns with a robust service ecosystem, your capacity increases and external pressures–such as labor shortages or regulatory shifts–become less disruptive.
Risks and mitigating steps keep the economics sound. Demand volatility can dampen ROI, so stress-test scenarios with “outside” volumes and cross‑regional routes. Maintain a stock of critical spares to avoid service outages that ruin uptime. Engage vendors with proven onboarding playbooks (including Wyman‑type integrators or benchmark providers) to shorten ramp times and improve alignment with maintenance cycles. A disciplined rollout–with clear milestones, strong data governance, and integrated fleet‑planning tools–reduces the chance of a single incident driving the project into a bad outcome. If markets shift or a major carrier adjusts capacity, the program should adapt rather than stall, preserving the higher stakes of automation investments in the long run.
結論:まずは小規模なパイロットで始め、成果連動型融資を確保し、明確な省エネ目標と稼働時間目標を達成してからスケールアップすること。設備投資を測定可能な成果に結びつけ、安全在庫と柔軟な資金調達を維持することで、より高い容量やバルク配線のような機会は、投機的な賭けではなく、永続的な価値創造サービスへと変わります。生産効率、コスト管理、信頼性の適切な組み合わせを追跡すれば、収益性の高い自動化への道は、困難なものではなく、明確なものとなるでしょう。.
規制要件、承認、および安全認証の実務
公道試験の開始前に、正式な安全事例を作成し、規制当局からの承認を得ること。安全事例では、ハザード分析、起こりうる故障モード、緩和策、および受け入れ基準を文書化し、予測可能な頻度でレビューが行われるように、規制当局のレビューサイクルに付随させる。このアプローチは、遅延を最小限に抑え、プラットフォームと資産の動きを維持しながら、環境要件と業界の期待に沿ったものとする。.
当局との連携を早期に行い、透明性の高い対話を維持する。米国では、FMCSA、NHTSA、DOTを経由し、州政府機関が場所固有の許可を発行します。他の地域では、UNECE WP.29の規定および各国の省庁がプロセスを形成します。規制当局がレビューし、整合性を図ることができるマイルストーンに合意し、データパッケージを提示します。調査対象は通常、ガバナンス、リスク管理、サイバーセキュリティ、およびデータ処理を網羅します。.
規格および安全認証は、厳格な証拠を要求します。SAE J3016レベルに準拠して自律性を定義し、機能安全のためにISO 26262を適用し、サイバーセキュリティのためにISO 21434を採用します。環境および大型トラックの運用については、適用されるFMVSSおよび地域の安全基準への準拠を確保してください。認証パスには、シミュレーション、路上パイロット、および第三者監査が含まれます。コストと期間は、数十億規模で測定されるプロジェクト予算と意思決定に影響を与えます。.
検証は、多層的なテスト計画を通じて行われます。シミュレーション、Hardware-in-the-Loop、および管理された実世界テストを使用して、信頼できるリスク台帳を作成します。バッテリー電気自動車のフリートについては、バッテリーの安全性、熱管理、充電スループット、および耐久性テストを統合します。環境データをプロセスの中心に据え、フリート全体のテレメトリーラインを追跡して、大規模な安全な運用を示します。.
業界の声が実践を支える。RaimondiとCenovusのデータによれば、明確な安全指標と規制当局向けのダッシュボードに支えられたパイロットプログラムは、承認期間を短縮する傾向にある。フリートマネージャーであるJohansonは、テレメトリーとリスク評価のデータラインを規制当局に示すことで信頼を築き、合意された制限下で資産を運用できると指摘する。Buffettの投資家は、予測可能なスケジュールと、展開計画を裏付ける慎重な資本配分に注目している。.
成果を加速するため、インフレを考慮した予算を計画し、承認の明確なペースを設定してください。よりスマートで監査可能な業務へのメガトレンドは、プラットフォームのアップグレード、車両調達、データプラットフォームを規制上のマイルストーンに合わせる早期採用者にメリットをもたらします。リスクの可視性と実証可能な安全性を向上させることで、車両を拡大し、資産を大幅にスケールすることができます。.
労働への影響:運転手の役割、トレーニングの必要性、移行経路
運転手を12か月以内に車両運行管理・安全監視の役割に転換させる段階的な再教育計画を立ててください。これにより、貴重な人材を維持しつつ、自動化の拡大に伴い信頼性を維持できる強力なオペレーターの中核を構築します。.
この変化を推進しているのは、安全性、コストの予測可能性、およびサービスの継続性です。一般的な導入では、ドライバーの役割は監督、データ解釈、および例外処理に移行し、自動化が長距離輸送とルーチンルーティングを処理します。この分担により、ドライバーは価値ある地位にとどまり、人材の完全な喪失を回避できます。また、従業員はキャリアを向上させるための明確な進歩を望んでいます。計画的に実施しない場合、チームは暗黙知を失い、結果が悪化する可能性があります。.
燃料効率と資産稼働率は、ローカルチームが自動化と連携することで向上します。大規模なフリートでは、連携された運転と継続的な稼働準備により、月ごとの燃料消費量を大幅に削減し、記録的な稼働時間を改善できます。これらの成果は収益を支え、移行期間中の運営コストを安定させると同時に、さまざまな業務分野の顧客との関係維持に役立ちます。.
業界のシグナルと開示は重要です。Nasdaqのデータによると、投資家は透明性の高い労働移行に関する開示情報と、慎重に構築された提供計画に好意的に反応します。Nasdaq関連のリサーチのアントニー氏は、市場はトレーニング投資と人材維持に関する明確さを評価していると指摘しています。Microsoftが支援するトレーニングプラットフォームとCoreweaveのクラウドシミュレーションを組み合わせた計画は、迅速に規模を拡大でき、広範な展開の前に一部のルートで試験運用が可能です。このアプローチは混乱を最小限に抑え、サービスレベルを維持しながら、エコシステム内の他の企業にもメリットをもたらします。.
- 評価とマッピング:運転手のスキルを棚卸しし、再配置に適した役割を特定し、必要なトレーニングモジュールを定義する。.
- スキルアップ:自動化インターフェース、テレマティクスダッシュボード、データリテラシー、安全プロトコルに関するモジュールを実装。変革管理や顧客コミュニケーションなどのソフトスキルも含む。完了目標時期と資格を定める。.
- 再配置と維持:運転手を運行サポート、メンテナンス調整、または顧客サービス連絡係の役割に再配置する。業績と資格に連動した給与帯とキャリアラダーを確立する。.
- 情報開示とガバナンス:ステークホルダー向けの人員移行計画を公開し、規制当局や投資家の期待に沿い、組織の知識を維持するために再訓練手当や給付金を提供する。.
- 測定と反復:安全に関する事故、稼働時間、走行距離、燃料使用量、運転手の定着率、およびトレーニング完了率を追跡します。四半期ごとのレビューの後、コンテンツとインセンティブを調整します。.
強力な指導体制の維持や、マイクロクレデンシャルへのアクセス確保といった他の施策も、士気を高く保ち、混乱を最小限に抑えるのに役立ちます。 実践的なスキルアップと明確な計画との組み合わせは、企業の収益を支え、NASDAQ上場企業やエコシステム内の他の企業を含む市場全体での地位を強化します。.
インフラストラクチャおよび運用:保守、マッピング、サイバーセキュリティ、およびデータガバナンス
投資資金は、フリート全体で統一されたメンテナンスおよびテレマティクスプログラムに充当し、データ品質に責任を持つ社内担当者を配置する必要があります。エンジン摩耗、燃料消費量、ブレーキの状態を監視するエッジデバイスを設置し、異常を数分以内に検出するライブダッシュボードを稼働させます。センサーアラートを作業指示に変換するローリング12ヶ月のメンテナンスカレンダーを確立し、ダウンタイムとコストのかかる路上故障を削減します。このアプローチは、全体的なメンテナンスコストを削減し、稼働時間を改善することが示されています。.
マッピングでは、車線レベルの詳細、動的な危険物レイヤー、および接続が低下した場合の冗長性を備えた高解像度マップを維持します。OTAアップデートを使用してデータを最新の状態に保ち、変更には2段階の承認を設定します。フィールドからの入力と、作成者によるコアマップの検証です。マップの出所をデータレイク内の専用ルームに保持し、ドリフトを避けるために月ごとのサイクルで変更を文書化します。.
サイバーセキュリティ:車両、路傍デバイス、およびクラウドサービスにゼロトラストフレームワークを実装します。エンジン制御モジュールおよびフリートアプリに対して、ハードウェアに根ざしたセキュリティ、セキュアブート、および署名付きファームウェアを強制します。トラック、デポ、およびクラウド間で、相互TLS、強力なID管理、およびネットワークセグメンテーションを使用します。四半期ごとの図上演習と継続的なモニタリングを、検出と対応をサポートするために、現在ヨーロッパ全域に展開されているマイクロソフトのセキュリティソリューションを使用して実行します。.
データガバナンス:データ生産者(保守チーム、車両テレマティクス)とデータ消費者(オペレーション、安全、計画)、およびパートナー間のデータ取引を分離するポリシーを定義する。メタデータカタログ、データリネージ、保持ルール、監査証跡を構築する。外部共有はデフォルトで制限し、パートナーアクセスにはベンダーリスク評価を義務付ける。明確な作成者主導のケイデンスを確立し、データ所有権とアカウンタビリティを調整するために、内部関係者およびJohansonからの意見を参考として収集する。コンプライアンスとデータ品質の向上を追跡する。.
実施計画と地域的範囲:欧州とサンタコリドーでパイロット運用を実施し、フルハウルオペレーションでメリットを定量化します。センサー、HDマップ、セキュリティツールへの購入意思決定は、投資された資金と連携させます。稼働時間、燃費、およびメンテナンスコスト/マイルを6〜12か月のライブデータで測定します。過去の事例から、これらの領域を統合したフリートは、総コスト/マイルを削減しています。著者と業界の声から意見を収集し、次回の展開に向けた利点と教訓をまとめます。石油サプライヤーおよびエンジンメーカーとのデータ共有を調整するためのガバナンスルームを設置し、持続可能な輸送戦略を強化し、werideパイロットによるより広範な採用への準備を確実なものにします。.