


This approach delivers measurable improvements: capex for regional hubs, streamlined fulfillment, and stronger branding with faster delivery. By locating warehouses near top-demand corridors, merchants can shorten inventory cycles, reduce stockouts, and convert demand into sales quickly.
These gains come with challenges: upfront investment in regional capacity, integrating inventory systems with legacy ERP, and maintaining service across mixed transport modes. Returns processing, reverse logistics, and fulfillment reliability must be designed to accommodate spikes in orders from foreign markets and seasonal peaks.
Opportunities emerge from data: regional inventory pools, adaptive forecasting, and e-commerces programs that align supply with local demand. By tying demand signals to procurement and investment in automation, firms can shorten transit times, lower carrying costs, and support branding that resonates with customers in this industry.
Action steps include mapping demand by region, setting target stock levels for each hub, and piloting two to four regional sites before scaling. Select partners able to offer multi-country fulfillment capabilities, integrate inventory visibility across regions, and link sales forecasts to supplier calendars. This alignment improves resilience and reduces lead times for shoppers in foreign markets.
Those adopting this approach gain resilience, improve customer satisfaction, and fortify e-commerces ecosystems. The result is a strengthened supply chain that supports ongoing investment, a healthier economy, and growing sales across regional corridors.
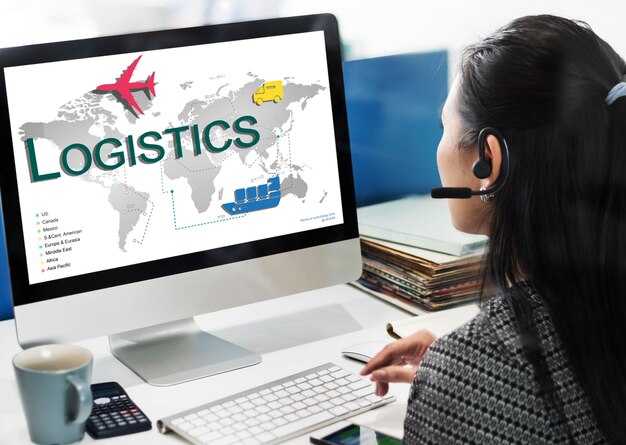
Strategic Imperatives for Modern E-commerce Logistics
Implement a unified integration platform that links inventory, order management, and transportation to reduce touchpoints and improve accuracy, enabling you to fulfill customers' orders within promised windows.
There is rising demand for speed and reliability across sectors, and you must align operations with import flows, government compliance, and scalable infrastructure. Expect to cut order cycle times by 20–35% and push on-time delivery above 95% in core markets as you expand e-commerces exposure and service areas.
- Framework and integration: Build a modular architecture that connects OMS, WMS, TMS, and last-mile partners. Use a unified data layer to accurately forecast needs and reduce stockouts. Invest in infrastructure that supports real-time visibility and cross-border import flows.
- Customer-focused delivery and marketing alignment: Synchronize buying signals with stock levels; set realistic delivery windows; leverage marketing insights to anticipate peak buying periods and adjust fulfillment plans there.
- Workforce and capability development: Upskill the operations teams with analytics tools, automation, and safety training; plan for a scalable workforce to handle peak seasons and international expansions.
- Government and compliance readiness: Implement clear data governance and privacy controls; ensure documentation for import compliance; maintain transparent reporting to regulators and partners.
- Resilience and risk management: Diversify suppliers, carriers, and warehouses; simulate disruptions to strengthen contingency plans; invest in energy-efficient infrastructure to manage rising costs.
- Innovation areas and metrics: Prioritize automation in packing, sorting, and returns processing; pilot AI routing and dynamic pricing in selected areas; track KPIs such as order accuracy, return rates, and logistics cost per order.
- Framework for sustainability: Set targets to reduce packaging waste and optimize returns flows; align with sustainability mandates and customer expectations.
- Buying and sourcing optimization: Use data to optimize procurement cycles, negotiate terms, and synchronize import schedules with carrier capacity; build a transparent supplier scorecard across sectors.
Real-Time Inventory Visibility Across Channels
Deploy a cross-channel inventory feed that unifies stock data from stores, fulfillment centers, marketplaces, and e-commerces portals into a single framework. Use event-driven microservices, robust APIs, and a centralized infrastructure to achieve real-time visibility at the SKU level. This approach boosts satisfaction for customers and reduces backorder risk for sales teams.
Key data streams should include POS, WMS, ERP, supplier feeds, and marketplace APIs. Implement a framework that updates inventory records every 2-5 minutes for high-velocity items and every 15-60 minutes for slow-moving SKUs, maintaining accuracy above 98% in most mid-market sectors. Use RFID or barcode scanning to minimize discrepancies in stores, while dynamic safety stock rules guard against stockouts in growing regions. The ability to surface product availability across a multi-channel chain improves customer confidence and reduces duty on customer service.
Across sectors from fashion to electronics, visibility across channels improves product availability, drives satisfaction, and boosts sales. In europe, small shops can compete with foreign retailers by offering accurate stock info across their own sites and marketplaces, supported by a scalable infrastructure and a modular framework. Real-time data reduces manual reconciliation and lowers operations workload by providing a single source of truth for inventory and supply decisions.
Developments in advanced analytics and AI enable smarter replenishment and tighter control of the inventory chain. Our recommended solutions combine demand signals, seasonality, and supplier lead times to keep stock aligned with growing demand across sectors and channels. For e-commerces portals, real-time stock updates curb backorders and improve customer satisfaction, helping sales teams convert more traffic into orders.
Implementation plan spans 90-120 days: two small stores, one regional warehouse, three channels, and one supplier feed. Target a fill rate above 97%, stockout rate under 1.5%, and a 40-60% reduction in manual inventory checks across operations. Track satisfaction and sales uplift, review developments every 30 days, and adjust the infrastructure accordingly to scale the framework across the supply chain.
Last-Mile Delivery Optimization in Urban and Suburban Contexts
Implement micro-fulfillment hubs within urban cores and dynamic routing to cut last-mile costs and speed deliveries. Place 6–8 micro-fulfillment nodes within 5–7 km of dense zones to serve stores and customers with same-day or next-day options. This shift improves management across the network and creates a scalable last-mile footprint for product-centric categories, with great potential for year-over-year growth. The approach supports teams looking to optimize logistical workflows and provides a consistent same-day experience for them.
In suburban contexts, balance zones by distance and adopt a mixed fleet for quick, localized deliveries. Use 2–3 neighborhood hubs to cover surrounding zones, with a mix of bikes, e-bikes, and small vans to balance speed and cost. Types of service should include B2C, BOPIS (buy online, pick up in store), and curbside pickup; each type adds flexibility. Since 2020, this approach has increased delivery density and reduced vehicle miles traveled in many industries; saudis businesses are accelerating adoption to strengthen their logistical resilience. источник: internal study shows increased adoption and improved service levels across industries.
Implementation steps include mapping zones by demand density, deploying parcel lockers at transit corridors, and enabling real-time tracking in a single management platform that coordinates inventories, stores, and carriers. Use AI-powered routing to compress last-mile trips by 15–30% and raise on-time delivery to 95%+ in dense markets. Align with local rules and regulations to avoid fines and delays; in saudis markets, ensure compliance with labeling, data-sharing, and permit requirements. The ideal approach blends urban micro-hubs with suburban buffers to maximize product availability and customer satisfaction.
Benefits include quicker response to demand spikes, higher customer satisfaction, and lower per-package costs. Monitor on-time delivery, average delivery window, and driver utilization; expect a 15–30% drop in last-mile cost and a 5–10 percentage-point rise in on-time rates in urban zones. For a quick win, pilot a 90-day program with two stores and one suburban hub, then scale to five hubs within a year. This approach provides measurable improvements since it began to be adopted in multiple industries and markets, with businesses reporting increased efficiency and consistent service levels.
Returns and Reverse Logistics for High-Volume D2C Models
Implement a dedicated returns portal and a quick triage workflow that routes each return by type within 48 hours to boost satisfaction and speed up restock.
Map reverse flows across sectors such as fashion, electronics, beauty, and many e-commerces channels to optimize outcomes for every return type and reduce hold times.
Apply data-driven rules to decide actions: return directly to inventory for quick resale, send items to refurbishment when feasible, or divert salvage to secondary markets.
Cut cost by centralizing the reverse flow in regional hubs and automating label generation, which trims logistical touches and lowers handling costs, improving the ability to reclaim value and delivering results that outperform traditional flows than before.
Offer same-day credit and easy drop-off options to boost satisfaction and shorten cycles, especially for high-demand SKUs, aligning with demand signals and supporting faster cash flow.
Link the network to global fulfillment centers, enabling direct transfers between import hubs and local returns points so the chain stays visible and supporting teams act quickly.
Integrate barcode or RFID scanning, AI-assisted sorting by condition, and dashboards that surface added data, enabling teams being informed in real time and enhancing visibility across the businesses across the chain.
Track metrics: return rate, restock time, salvage rate, cost per return, and customer satisfaction to guide daily tweaks and long-term changes.
Carrier Selection, Freight Auditing, and Cost Control Tactics
Begin with a data-driven carrier selection: score providers on transit reliability, rate transparency, and settlement accuracy; implement automated freight auditing within 14 days of shipment. This approach yields increased visibility into landed cost and makes the cost center accountable with measurable ROI.
Define the scoring framework around three pillars: transit reliability, rate transparency, and auditability. Build a short list of 5–7 providers that cover your most critical lanes and demand patterns; lock in rate validity for core contracts and set clear service-level requirements to reduce demurrage and detention.
Unprecedented market conditions require consolidation and standardized contracts to gain leverage.
To extend control beyond selection, implement a two-tier freight audit: post-shipment verification for rate accuracy and pre-pay verification to catch duplicates, incorrect zone charges, and surcharges. This approach improves accuracy and reduces settlement variance across shipments.
Advanced analytics unlock opportunities to align capacity with demand in real time. Analyze lanes across areas and transitions to identify underperforming providers, route shifts, and consolidation options that yield economies of scale. This can greatly improve service consistency and cost predictability across the same set of providers, as demand grows in most regions.
Concrete cadence and governance drive results. Establish onboarding timelines for new providers, set a quarterly review cadence, and track KPIs such as on-time delivery, cost per shipment, savings from audit corrections, and audit-resolution accuracy.
| Carrier | Transit reliability | Rate transparency | Audit accuracy | Estimated annual cost | Recommendation |
|---|---|---|---|---|---|
| Carrier A | 92% | 88% | 97% | $1,150,000 | Proceed with base contract; negotiate accessorials |
| Carrier B | 88% | 90% | 95% | $1,260,000 | Consider for high-visibility lanes; lock-in rebate program |
| Carrier C | 85% | 84% | 92% | $1,180,000 | Use selectively on secondary lanes |
Technology Stack Integration: WMS, TMS, OMS Orchestration
Implement a unified orchestration layer that binds WMS, TMS, and OMS via standardized APIs and real-time events. This reduces manual handoffs, strengthened data integrity, and creates a single source of truth for fulfillment. For professional teams, this enables good performance and clearer visibility across the supply chain. Stores gain real-time visibility into stock at the store level, and a framework that supports strategies for scale with clearly defined contracts between systems. Noted by early pilots, this approach has developed to address the e-commerces boom. There, a vendor that sells direct-to-consumer benefits from improved order routing and a year-over-year uplift in customer success.
Three core areas drive value: Inventory synchronization via WMS, transport planning and execution via TMS, and order orchestration plus returns via OMS. Design the stack with event-driven microservices and well-defined API contracts; a lightweight, scalable framework that can be developed further in-house. The involved teams from operations, IT, and merchandising must participate in the testing and rollout, because this collaboration contributes to faster, more reliable results. Build store-facing dashboards to provide real-time visibility where planners and agents can act on inventory, orders, and shipments. There is value in standardizing event schemas so developers can innovate rapidly. This pattern has developed as teams learned from pilots, and there is a clear path to supporting those e-commerces with a robust architecture. Provide always-on visibility for stakeholders, and ensure there is a feedback loop to keep improving.
Track fulfillment cycle time, on-time in-full rate, inventory accuracy, and transportation cost per order to demonstrate return on investment. Set staged milestones: 30-day pilot, 90-day expansion, 180-day full rollout. Expected gains include shorter fulfillment cycles, stronger visibility, and higher customer success. Tie outcomes to revenue by reducing mis-shipments and improving cross-channel opportunities for those brands that contribute to the year’s growth. Use dashboards and alerts to keep involved teams aligned, and adjust plans as data informs where to invest next.