




The most instructive supply chain case study I know is not a success. In June 2017 the NotPetya malware reached Maersk and the company rebuilt roughly 4,000 servers and 45,000 personal computers in about ten days, at an estimated cost of 250 to 300 million dollars. The recovery worked partly because one domain controller in Ghana had been offline when the attack hit, and that surviving copy of the directory made the rebuild possible. We covered the Maersk attack in full separately.
Most collections of case studies skip that kind of detail. They describe a company that adopted a system and improved a metric, which is pleasant reading and useless for planning. The cases below are the ones I actually cite, chosen because each has a public number attached and a root cause you can argue with.
Ten supply chain cases with numbers attached
| Case | Year | Published impact | Root cause worth studying |
|---|---|---|---|
| Maersk and NotPetya | 2017 | 250 to 300 million dollars, 4,000 servers rebuilt | Flat network, single shared directory, no offline recovery copy by design |
| Nike and i2 demand planning | 2000 | About 100 million dollars in lost sales | Forecast output trusted over store managers who could see actual demand |
| Hershey ERP go-live | 1999 | About 150 million dollars of orders undelivered | Big-bang cutover scheduled into the Halloween peak |
| Lidl and SAP | 2018 | About 500 million euro written off after roughly seven years | Core inventory valuation logic customised rather than adopted |
| Target Canada | 2013 to 2015 | Market exit after two years, losses around 2 billion dollars | Master data errors in dimensions and barcodes jammed the distribution centres |
| Ever Given in the Suez Canal | 2021 | 6 days aground, about 400 ships queued, insured losses estimated above 2 billion dollars | Single point of failure on a heavily used route, with pilotage in high wind as the proximate cause |
| Toyota after the Tohoku earthquake | 2011 | Multi-tier database covering hundreds of thousands of parts | Tier-one visibility was never the constraint, tier-four was |
| TradeLens | 2018 to 2022 | Shut down after 4 years despite 175 or more participants | Technology worked and carriers joined, yet would not commit data to a competitor's platform |
| Semiconductor shortage at Ford | 2021 | Company guided to roughly 2.5 billion dollars of impact | Cancelled chip orders in 2020 could not be reinstated at will |
| Amazon network regionalisation | 2023 | United States network reorganised into regional clusters | Reducing distance travelled beat adding capacity |
Maersk 2017: the case that changed my questions
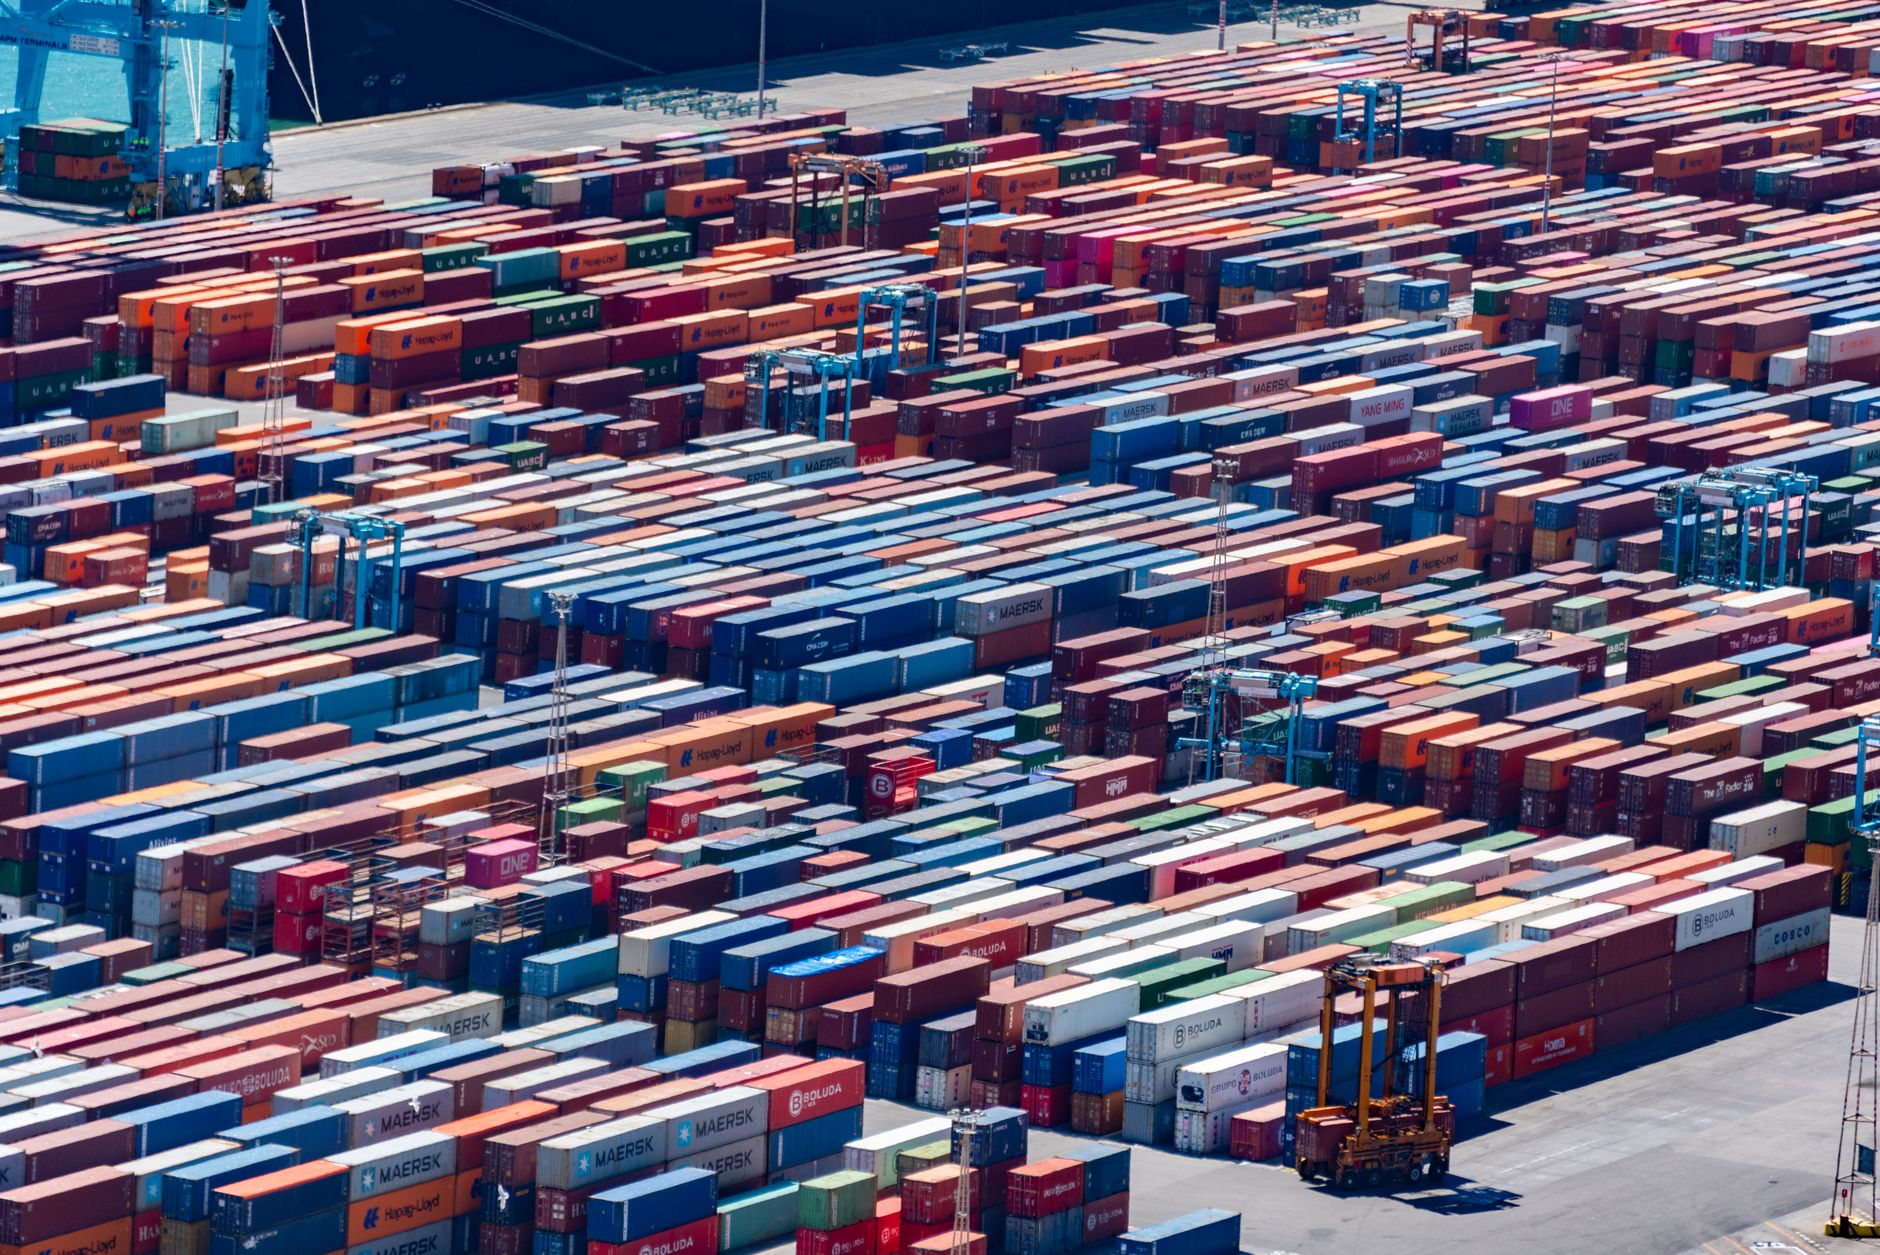
NotPetya entered through a compromised update to Ukrainian tax software and spread laterally, encrypting machines faster than anyone could respond. Maersk lost booking systems, and terminal operations across a large part of its network went manual. Ships kept arriving because ships do not stop, which is the part planners underestimate: a digital outage in shipping does not pause the physical flow, it removes your ability to know what the flow contains.
Two lessons survive the retelling. Recovery capability decided the outcome more than prevention did, and the recovery depended on an accident rather than a design. When I review continuity plans now, my first question is no longer whether backups exist. It is whether anyone has rebuilt a directory service from those backups inside a test window, and how long it took.
Hershey 1999 and Lidl 2018: the same mistake at twenty years' distance
Hershey replaced core systems with a simultaneous cutover and hit the confectionery industry's peak season with an order-to-delivery process nobody had run at volume. Roughly 150 million dollars of orders could not be shipped, and the quarter's profit fell sharply.
Lidl spent about 7 years on an inventory and merchandising programme before abandoning it and writing off in the region of 500 million euro. The reported technical sticking point was mundane: Lidl valued stock at purchase price, standard software assumed retail price, and rather than change the business practice the project changed the software. Customisation in the valuation core then propagated downstream. The decision to stop was commercial rather than technical, taken once the remaining benefit stopped justifying the spending the programme still needed.
Both cases argue for the same discipline. Sequence the cutover away from peak, and treat every request to customise a core calculation as a decision that will outlive the people making it.
Toyota 2011: visibility at the tier you cannot see
After the March 2011 earthquake Toyota discovered that its exposure sat well below its direct suppliers, in specialised chemicals and components where a single plant served much of the industry. The response was a supply chain database mapping parts and suppliers several tiers deep, which let the company answer a question most manufacturers still cannot: if this town floods, which of my vehicles stop.
The reason I keep using this case is that it contradicts how most visibility projects are scoped. Teams buy tools that show container positions, which is tier-one logistics data, while the risk that stops a production line lives four tiers upstream in a factory whose name is not in any of their systems.
TradeLens: a failure that was not technical
TradeLens was a blockchain platform for shipping documentation, launched by Maersk with IBM in 2018 and discontinued in 2022. The technology functioned, and the network was not empty either: more than 175 organisations joined, including five of the six largest container carriers. It still closed. Signing up and committing turned out to be different decisions, and rival carriers never routed enough commercial data through a platform owned by their largest competitor to make the volumes work.
This is the case to read before any industry-wide data-sharing initiative. The hard problem in shared visibility is governance and ownership, not cryptography, and neutrality has to be structural rather than promised. The contrast is the DCSA track and trace standards, which carriers did adopt because no single competitor owned them.
How to read a case study without being sold to
Most published case studies are marketing collateral produced with the vendor's cooperation, which does not make them worthless but does change how you should read them. My checklist:
- Find the baseline. A claim of thirty percent improvement means nothing without the starting figure and the measurement window.
- Check who published it. If the software supplier wrote it, the failure modes will be missing. Regulatory filings, court documents and post-incident reports carry the detail that press releases remove.
- Look for the counterfactual. Volumes, prices and demand all moved during the period. Ask what would have happened anyway.
- Prefer cases with dates and dollar figures. Anything that cannot be pinned to a quarter and a number is an anecdote wearing a suit.
- Read the failures first. Successful projects are diverse and hard to copy. Failures repeat, which makes them more predictive of what will happen to yours.
- Check the tier. Ask which level of the chain the case actually addresses, because most claim end-to-end scope and deliver tier-one scope.
Using these cases in a business case
A case study earns its place in an internal proposal when it establishes a number you would otherwise have to guess. Maersk 2017 gives a defensible order of magnitude for a total systems outage at a large logistics operator. Hershey and Lidl give go-live risk a price. Ford in 2021 shows what cancelling supplier commitments during a downturn can cost when demand returns faster than capacity.
What none of them will do is prove that a specific tool suits your operation. The pattern I have watched work is narrower: pick the two cases whose failure mode most resembles your own weak point, quantify what that failure would cost in your volumes, and let the comparison set the budget. That argument survives scrutiny from a finance director, which is more than most benchmark decks manage.