


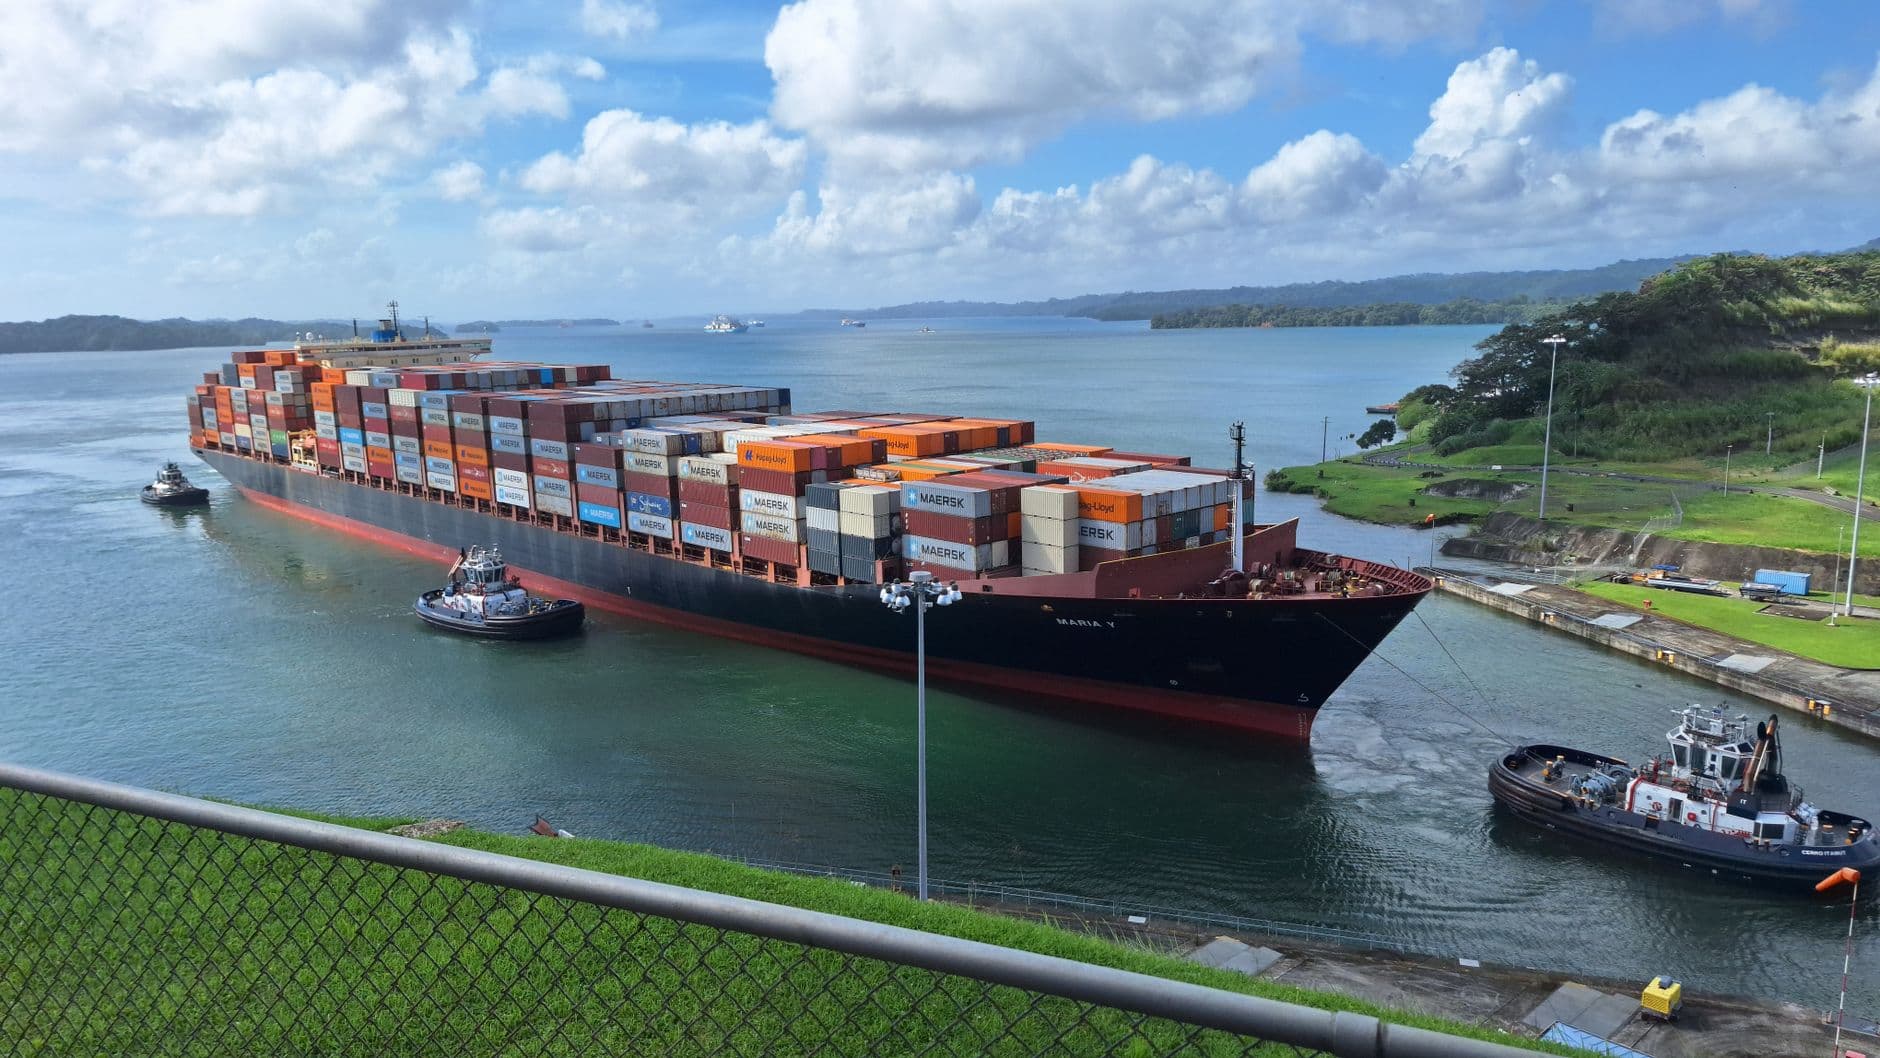

Ask which is the world's busiest canal and most people say Suez or Panama. The real answer is neither, and the gap between the popular answer and the true one is exactly why this ranking is worth a shipper's time. Count ships, and a canal in northern Germany moves more vessels than Suez and Panama combined. Count tonnage and strategic trade value, and Suez and Panama are in a different league. At GetTransport.com we route ocean freight through these chokepoints every week, so we read the canal ranking the way we read a port: not as a trivia leaderboard, but as a map of where a single stretch of water can make or break a schedule. Here is the 2026 picture, with figures from the canal authorities, and what each canal means for the cargo you move.
The ranking, by traffic and tonnage
The table below draws on the canal authorities and standard references. Read the transit column and the tonnage column separately, because they crown different canals, and that split is the whole point.
| Canal | Length | Ship transits per year | Role / tonnage |
|---|---|---|---|
| Kiel Canal (Germany) | about 98 km | about 22,262 (2025) | Busiest by ship count; about 69.4 million tonnes in 2025 |
| Suez Canal (Egypt) | about 193 km | about 19,300 (pre-crisis) | Busiest by tonnage; ~522M net tons in 2025 (1.2B before the Red Sea crisis) |
| Panama Canal | about 82 km | about 13,404 (FY2025) | Strategic US-Asia link; about 489 million tons (FY2025) |
| Grand Canal (China) | about 1,776 km | domestic barge traffic | Longest canal in the world; inland, not ocean-going |
So there are three different winners. Kiel is busiest by the number of ships, Suez is busiest by tonnage and ocean-going trade, and China's Grand Canal is by far the longest at about 1,776 km, though it carries domestic barges rather than international ships. A shipper needs to know which measure applies before drawing any conclusion from the word "busiest".
Kiel, the busiest by ship count
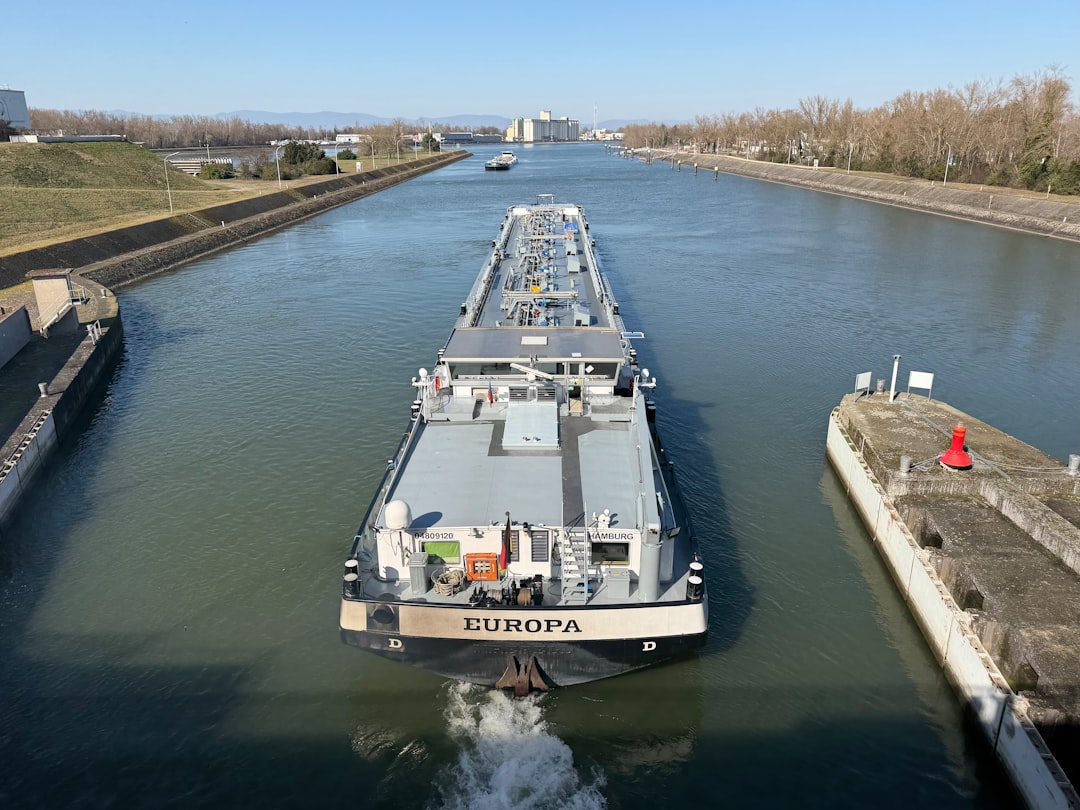
The Kiel Canal cuts about 98 km across the neck of Denmark's peninsula, linking the North Sea to the Baltic and saving ships the long haul around the top of Denmark. It handles somewhere between 22,000 and 30,000 transits a year depending on the period, which is more traffic by vessel count than Suez and Panama put together. What it does not carry is their tonnage. Most of the ships using Kiel are smaller feeders, coasters and bulk vessels on intra-European runs, moving about 69.4 million tonnes in 2025, down from around 100 million in stronger years.
For a shipper the lesson is that ship count and cargo weight measure completely different things. A canal can be the busiest on earth by number of vessels and still be a regional shortcut rather than a global trade artery. We treat Kiel as exactly that, a time-saver for Baltic and North Sea feeder traffic, not a chokepoint that reshapes intercontinental rates.
Suez and Panama, the canals that move world trade
Suez and Panama earn their fame on tonnage and strategic value, not on ship count. The Suez Canal, about 193 km long, handled roughly 19,300 vessels and about 1.2 billion net tonnes before the Red Sea crisis, carrying a large share of the container and energy trade between Asia and Europe; in 2025, with much of that traffic diverted, its throughput fell to around 522 million net tons. The Panama Canal, about 82 km long, ran about 13,404 transits and 489 million tons in fiscal 2025, and it is the pivot for trade between Asia and the US East Coast.
These two are where a canal stops being a convenience and becomes a rate-setter. When either is constrained, the effect ripples through global schedules and pricing in a way Kiel never could. That is why, when a client ships between Asia and Europe or Asia and the US East Coast, we watch the state of these two waterways as closely as we watch the ports at each end.
Disruption and slot economics
The past two years have shown how fragile these arteries are. Attacks on shipping in the Red Sea from 2024 pushed Suez traffic roughly 60% below normal, sending hundreds of vessels on a detour around the Cape of Good Hope that adds about 14 days to an Asia-Europe voyage. This is not a closed chapter: as of mid-2026 Suez traffic is still about 60% below its 2023 level, because even after the Houthis signalled an end to attacks the major lines have stayed cautious and not fully returned. Panama tells the opposite story now. It faced a drought that cut daily slots and maximum draft, but by 2026 the canal has recovered and is operating at full capacity again, with the water restrictions lifted, though a few segments still run just below pre-drought volumes.
Both cases turn a canal from a fixed shortcut into a variable cost. A detour adds fuel, charter days and schedule risk, while a draft cut means a vessel carries less cargo per sailing. We build those contingencies into ocean planning rather than assuming a canal is always open at full capacity, and it is the same slot-economics thinking behind our guide to the Panama Canal booking window.
What the canal ranking means for a shipper
Read as an operating map, the canals sort into clear roles for anyone moving ocean freight:
- We read "busiest" carefully, since Kiel leads on ship count while Suez leads on tonnage, and only the tonnage leaders move global rates.
- We treat Suez and Panama as rate-setting chokepoints, watching their status as closely as the ports at each end of a lane.
- We build in disruption, because a Suez detour around the Cape adds roughly 14 days and a Panama draft cut means less cargo per sailing.
- We keep regional shortcuts like Kiel in their place, useful for feeder timing but not a driver of intercontinental cost.
- We separate length from importance, since the longest canal, China's Grand Canal, is a domestic inland route rather than an ocean artery.
None of this replaces a live schedule and a firm booking. But it explains why the busiest canal by one measure is almost irrelevant to your rate while another canal quietly sets it, the same reason the hub in the middle matters more than the endpoints on the busiest shipping routes.
Frequently asked questions
What is the busiest canal in the world in 2026?
By number of ship transits it is the Kiel Canal in Germany, which handled about 22,262 vessels in 2025, more than the Suez and Panama Canals combined. By tonnage and global trade value the Suez Canal leads, though Red Sea disruption cut its 2025 throughput to around 522 million net tons from about 1.2 billion before the crisis, so the answer depends on the measure you use.
Which canal is most important for global trade?
The Suez Canal for Asia-Europe trade and the Panama Canal for Asia to US East Coast trade. Suez moved about 19,300 vessels and 1.2 billion net tonnes before the Red Sea crisis, and Panama about 13,404 transits and 489 million tons in fiscal 2025, so both carry the ocean-going container and energy traffic that sets global rates.
How do canal disruptions affect shipping costs?
They turn a fixed shortcut into a variable cost. Red Sea attacks cut Suez traffic about 60% below normal from 2024, and as of mid-2026 it remains roughly 60% below its 2023 level as lines keep routing around the Cape, adding about 14 days per Asia-Europe voyage. Panama has instead recovered, operating at full capacity again after its drought restrictions were lifted. Both show how fast a canal can swing from fixed shortcut to variable cost.