


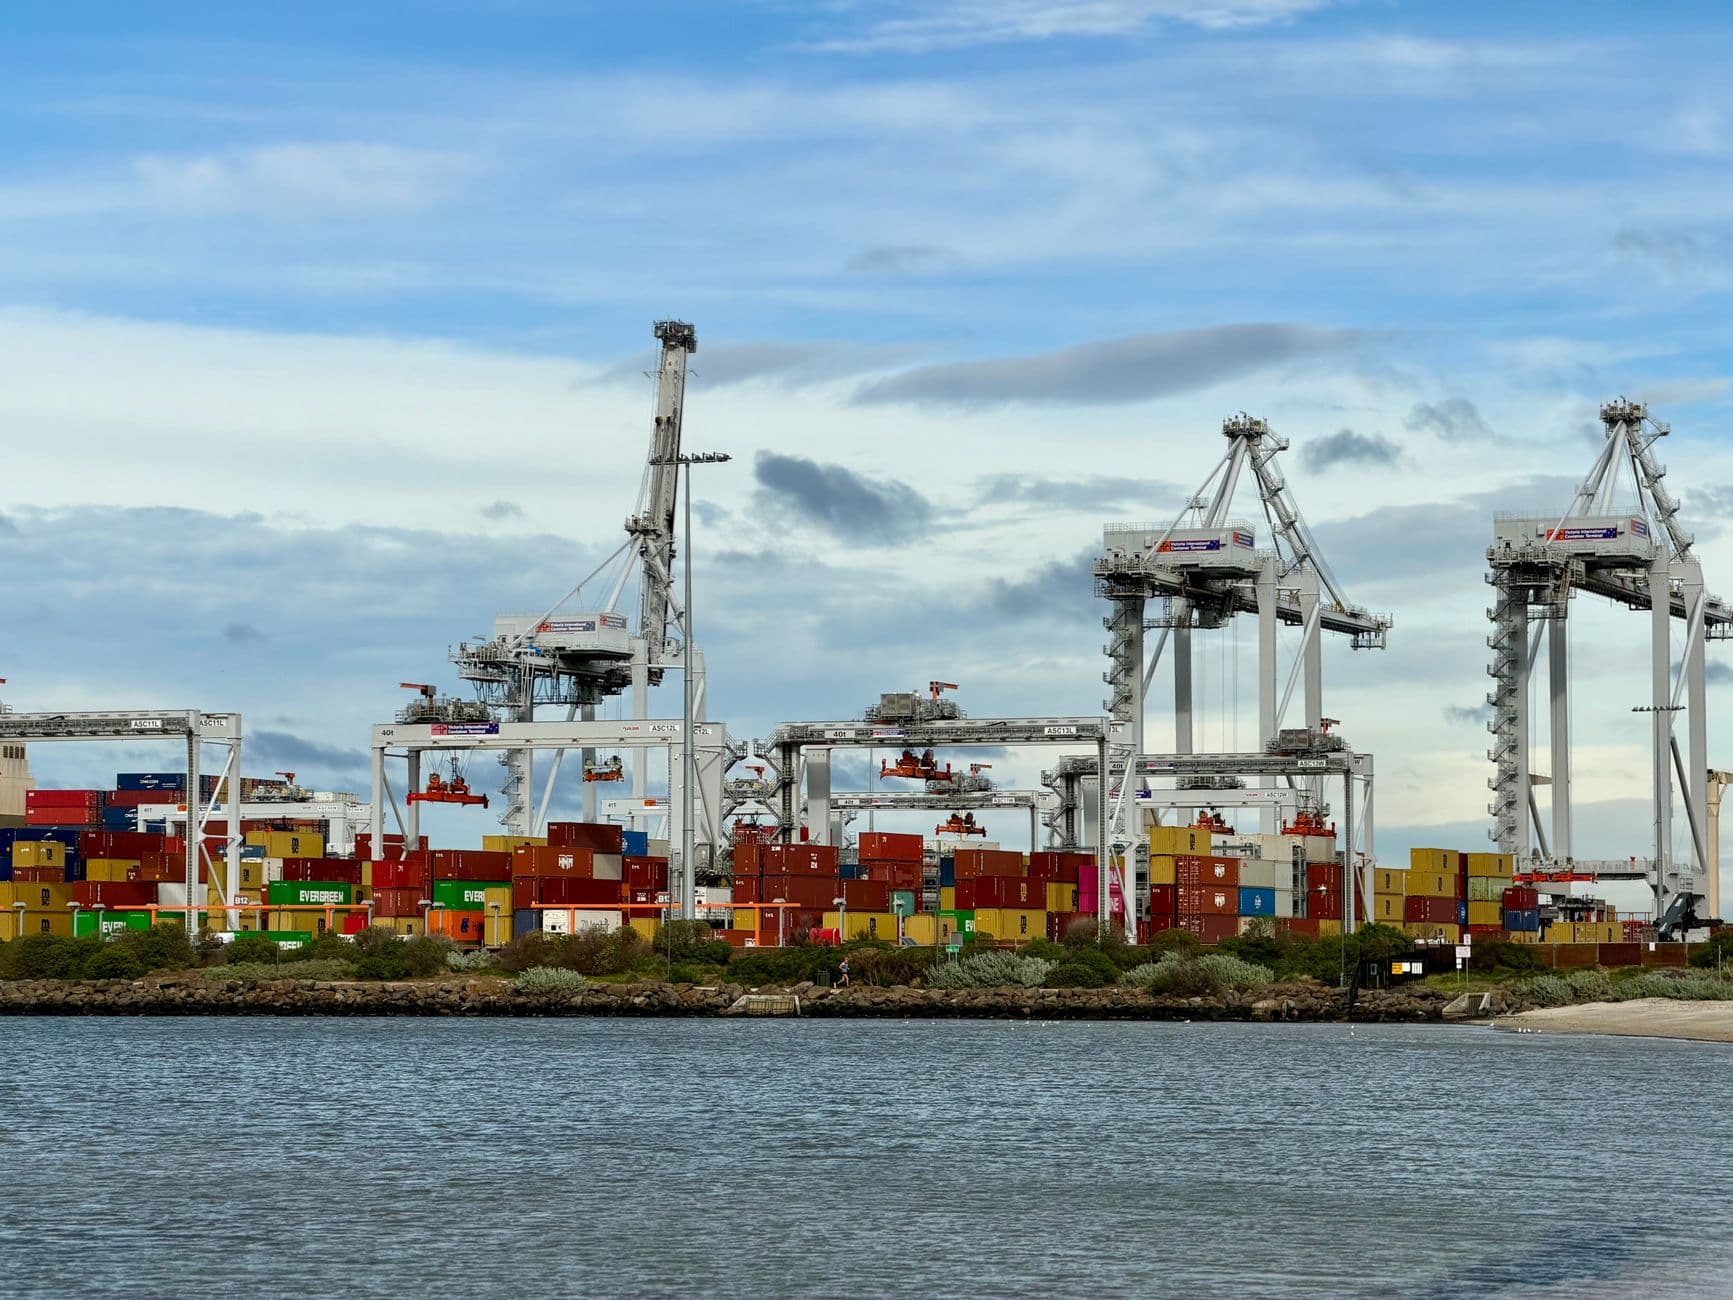

Коли відправники запитують нас, який порт є найбільшим у світі, ми зазвичай відповідаємо власним запитанням: найбільшим за якими показниками? На GetTransport.com ми щотижня бронюємо місце для контейнерів через ці хаби, і рейтинг, який має значення для вантажу в коробках, повністю залежить від того, як ви рахуєте. Розставте порти за обсягом контейнерного трафіку в TEU, і Шанхай опиниться на вершині, подолавши позначку в 55 мільйонів контейнерів у 2025 році, ставши першим термінальним комплексом, який коли-небудь перевалив 50 мільйонів за рік. Якщо ранжувати ті самі порти за загальною вагою вантажу, враховуючи руду, зерно, нафту та вугілля, які ніколи не потрапляють у контейнер, то пальму першості здобуває інший китайський порт — Нінбо-Чжоушань. Цей розрив між двома таблицями лідерів — не дрібниця. Він показує, для чого насправді побудовано порт, і змінює те, чого слід очікувати, коли ваш контейнер прибуває туди. Ось картина 2026 року, складена на основі найновіших повних річних показників, і як ми її інтерпретуємо, коли плануємо відвантаження.
Рейтинг 2025 року та звідки беруться цифри
Орієнтиром, на який спирається галузь, є дані Lloyd's List та World Shipping Council щодо обсягів контейнерних перевезень, з показниками за 2025 рік для провідних портів, де вони були опубліковані, а порядок на 2024 рік залишається незмінним для решти. Загальний обсяг контейнерних перевезень досяг приблизно 937 мільйонів TEU у 2024 році, а найактивніші порти встановили нові рекорди протягом 2025 року. Зростання не було рівномірним. Китайські порти зайняли чотири з п'яти перших місць і шість з десяти, а азійські порти — чотирнадцять з двадцяти.
| Рейтинг | Порт (країна) | Роль / примітки | Пропускна спроможність контейнерів (TEU; 2025 для лідерів, інакше 2024, за даними Lloyd's List/WSC) |
|---|---|---|---|
| 1 | Шанхай (Китай) | Найзайнятіший 16-й рік поспіль; перший порт, що подолав 50 млн TEU | близько 55,06 мільйона (2025) |
| 2 | Сінгапур | Чистий транзитний суперхаб | приблизно 41,1 мільйона (2025) |
| 3 | Нінбо-Чжоушань (Китай) | Перший показник понад 40 мільйонів TEU; також найбільш завантажений порт за загальною тоннажністю вантажів | близько 43 мільйонів (2025) |
| 4 | Шеньчжень (Китай) | Експортний шлюз Південнокитайського моря | близько 33,4 мільйона |
| 5 | Циндао (Китай) | Північні ворота Китаю, швидке автоматизоване розширення | близько 30,9 мільйона |
| 6 | Гуанчжоу (Китай) | Ворота в дельту річки Перл | близько 26,1 мільйона |
| 7 | Пусан (Південна Корея) | Транзитний вузол Північно-Східної Азії | близько 24,4 мільйона |
| 8 | Тяньцзінь (Китай) | Пекінський регіональний шлюз | близько 23,3 мільйона |
| 9 | Джебель-Алі, Дубай (ОАЕ) | Транспортний вузол на Близькому Сході | близько 15,5 мільйона |
| 10 | Порт-Кланг (Малайзія) | Трансшипмент у Малаккській протоці | приблизно 14,6 мільйона |
| 11 | Роттердам (Нідерланди) | Найзавантаженіший контейнерний порт у Європі | близько 14,2 мільйона (2025) |
| 12 | Гонконг (Китай) | Знижуючись зі свого колишнього піку в трійці найкращих | близько 13,7 мільйона |
| 13 | Антверпен-Брюгге (Бельгія) | Другий за обсягом вантажообігу порт Європи | близько 13,5 мільйона |
| 16 | Лос-Анджелес (США) | Найжвавіший контейнерний порт в Америці | близько 10,3 мільйона |
Ми показуємо тоннажні показники до одного десяткового знака, оскільки саме з такою точністю їх надає джерело, і ми розглядаємо позиції нижче першої десятки як рухомі. Там позиції змінюються на один-два пункти більшість років, оскільки перевізники перерозподіляють послуги, тому ми читаємо таблицю як карту концентрації контейнерних потужностей, а не як фіксований рейтинг.
Чому Шанхай лідирує за обсягами (у konteynerax), а Нінбо-Чжоушань – за тоннажем
Саме це розділення збиває з пантелику. Шанхай обробив найбільше контейнерів, але Нінбо-Чжоушань, що знаходиться за годину їзди від узбережжя, перемістив більше вантажів за загальною вагою, ніж будь-який порт на Землі – понад 1,4 мільярда тонн, і вже сімнадцятий рік поспіль утримує першість за цим показником. Причина в тому, що значна частка обсягу Нінбо-Чжоушань становить сухі та рідкі насипні вантажі – залізну руду, сиру нафту та вугілля, які надходять у трюмі судна насипом і ніколи не потрапляють у контейнер. Порівняно з цим, у Шанхаї значно більша частка контейнеризованих промислових товарів, саме те, що вимірюється в таблиці TEU.
Для контейнерного перевізника практичне читання є простим. Рейтинг TEU показує, наскільки глибокою є мережа портів для контейнерів, скільки контейнерних служб його відвідують, скільки відбувається перевалки, наскільки легко знайти відправлення. Тоннажний рейтинг показує, скільки сировини проходить через порт, що має значення, якщо ви перевозите проєктні або насипні вантажі, але мало говорить про ваші контейнерні місця. Ми дивимося на колонку TEU, коли бронюємо контейнер, і ігноруємо тоннажний рейтинг, якщо тільки клієнт не відправляє щось, що перевозиться балкером.
Китайський кластер та що означає для ваших рейсів потрапляння шести компаній до топ-десятки
Шість з десяти найжвавіших контейнерних портів розташовані на материковому Китаї, і ця концентрація є найкориснішим фактом у таблиці. Коли така велика кількість високочастотних шлюзів розташована на відстані кількох днів морського ходу один від одного, перевізники можуть об'єднати їх в один азійсько-європейський або транстихоокеанський маршрут, що надає відправнику реальний вибір. Якщо в піковий тиждень Шеньчжень перевантажений, ми часто можемо перенести бронювання до Гуанчжоу або Наньша, не залишаючи дельти річки Перл, а штраф за час доставки вимірюється годинами, а не днями.
Ця щільність також пояснює, чому китайські походження, як правило, пропонують найдешевші морські тарифи на більшості маршрутів. Частота — це конкуренція. Більша кількість викликів на тиждень означає більше місця, що бореться за той самий вантаж, і ціни слідують за цим. Ми враховуємо це при наданні порад щодо походження, коли клієнт має гнучкість у виборі місця виробництва чи консолідації продукту.
Трансшлюпвальні вузли проти портів-хабів
Рейтинг змішує два типи портів, які поводяться дуже по-різному, і ця відмінність рідко відображається у пропозиції. Сінгапур є найчіткішим прикладом транзитницького суперхабу. Він посідає друге місце у світі за обсягом контейнерів, але місто-держава не є походженням чи призначенням більшості цих контейнерів. Їх вивантажують з одного судна, розміщують і завантажують на інше, яке прямує в інше місце. Джебель-Алі, Порт-Кланг і Танджунг-Пелепас виконують ту ж роль пересадки для своїх регіонів.
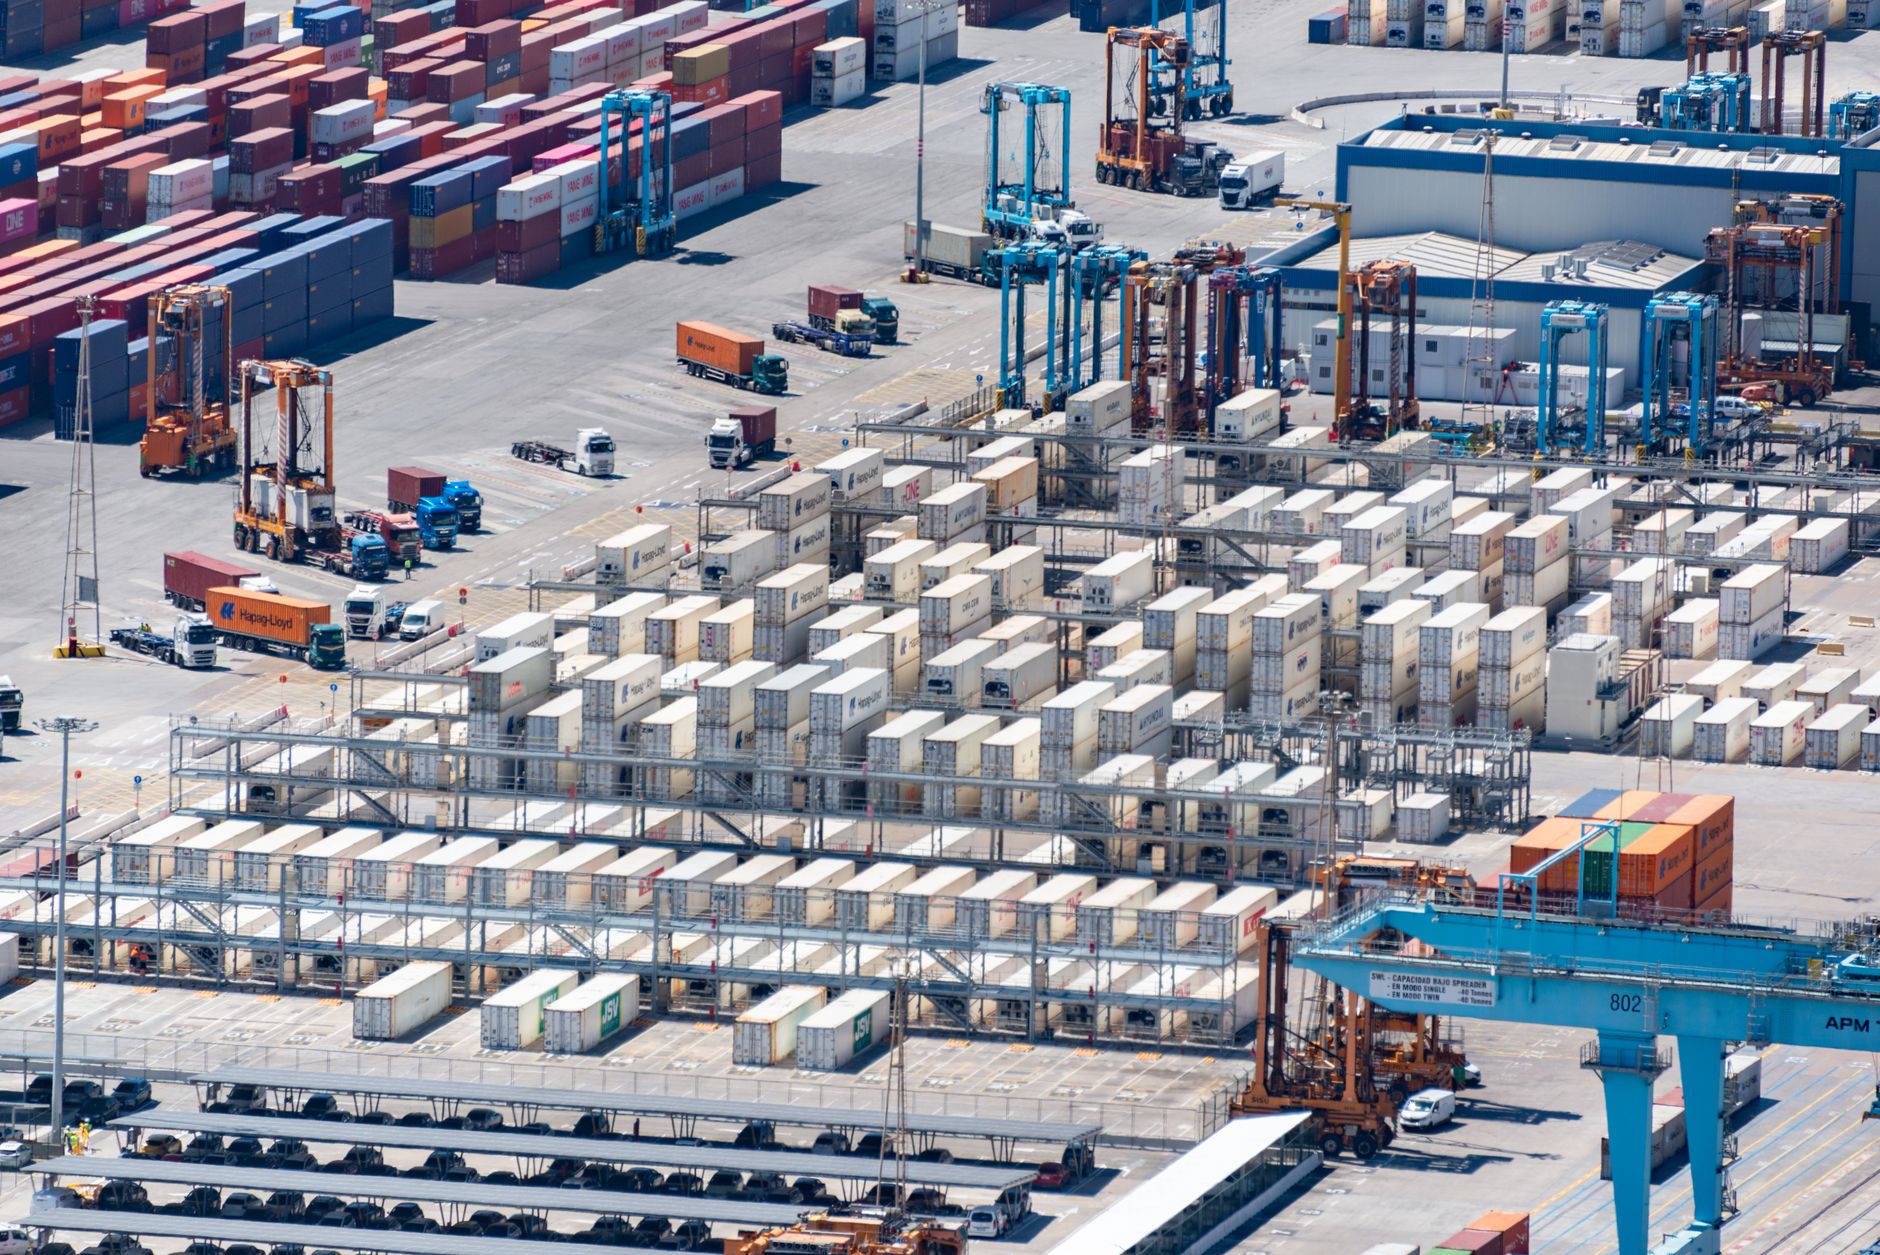
Порт-хаб, на відміну від цього, є місцем, де товари фактично в'їжджають або виїжджають з економіки країни. Лос-Анджелес — це порт-хаб; майже все, що прибуває туди, призначене для Сполучених Штатів. Причина, чому це важливо для вас, — це час простою та надійність. Коли ваш контейнер проходить через вузол, як-от Сінгапур, він проходить додатковий етап обробки та має додаткову можливість пропустити наступне з'єднання. Ми не уникаємо перевантаження, оскільки маршрути, які його використовують, часто бувають швидшими та дешевшими, ніж прямі рейси малої потужності. Ми враховуємо цю додаткову передачу під час оцінки ризику, а для термінових вантажів ми схиляємося до прямих заходів у порти-хаби, де ми можемо їх знайти. Та ж логіка визначає, як ми читаємо найзавантаженіші морські шляхи та торговельні лінії, оскільки вузол посередині зазвичай визначає розклад.
Європа та Америк, і що насправді означає нижчий ранг
Роттердам – найжвавіший портовий термінал для контейнерів у Європі, який у 2025 році перевантажить приблизно 14,2 мільйона TEU, що на 3,1 відсотка більше, ніж минулого року, і посідає одинадцяте-дванадцяте місце у світі, а Антверпен-Брюгге йде за ним. Жоден з них не входить до десятки найпотужніших у світі, і це не применшення. Європейський обсяг перевезень розподіляється між багатьма потужними портами, а не концентрується у двох-трьох гігантів, як у Китаї, тому жоден окремий європейський хаб не демонструє показників азійського масштабу. Для відправника, який імпортує товари до Європи, такий розподіл є перевагою, оскільки це означає наявність кількох надійних варіантів розвантаження для конкретного внутрішнього пункту призначення.
Америки розповідають гострішу історію. Лос-Анджелес, найжвавіший контейнерний порт у півкулі, посідає близько шістнадцятого місця у світі з приблизно 10,3 мільйона TEU. Порівняно з 51,5 мільйона Шанхаю, ця різниця є корисним нагадуванням про те, що північноамериканські порти є воротами, що обслуговують один великий ринок, а не багатоцільовими пересадковими гігантами Азії. Це також пояснює, чому затори на Західному узбережжі так сильно відчуваються, коли обсяги імпорту різко зростають: у системі значно менше резервних причалів та складських потужностей, ніж могли б свідчити азійські цифри.
Як насправді змінює ваше бронювання рейтинг контейнерного терміналу (TEU)?
Розглядайте цю таблицю як робочу карту, а не табло. Вона відображає низку конкретних рішень, які ми приймаємо від імені відправника. Ось як ми її використовуємо:
- Ми розглядаємо високий рейтинг TEU як показник частоти обслуговування та варіантів відновлення, а не як обіцянку низького часу перебування або швидкого обороту воріт.
- Ми використовуємо щільність китайських кластерів для перенесення бронювань між сусідніми шлюзами, коли один із них перевантажений, зберігаючи невеликий штраф за транзит.
- Ми відділяємо перевалочні вузли від справжніх шлюзів і додаємо резервний день, коли маршрут залежить від транзитного порту для вантажу, чутливого до термінів доставки.
- Ми не розглядаємо нижчий глобальний рейтинг європейського чи американського порту як слабкість, оскільки такі порти обслуговують окремі великі ринки, а не діють як регіональні перевалочні вузли.
- Ми перевіряємо рейтинг тоннажу лише тоді, коли клієнт відправляє насипні або проектні вантажі, оскільки він не дає нам корисної інформації про контейнерні місця.
Жодне з цього не замінює чітке бронювання та вікно причалу. Але це пояснює, чому два порти, які виглядають взаємозамінними на карті, можуть поводитися дуже по-різному в піковий тиждень, і це та сама логіка масштабу, яку ми застосовуємо, коли дивимося на найбільші контейнеровози та судноплавні компанії, що заходить у ці термінали.
Найчастіші запитання
Який найзавантаженіший контейнерний порт у світі у 2026 році?
Шанхай посідає перше місце з приблизно 55,06 мільйона TEU у 2025 році, що на 6,9 відсотка більше, це шістнадцятий рік поспіль, як він є найзавантаженішим у світі, і значно перевищує позначку в 50 мільйонів, яку він вперше подолав раніше. Сінгапур посідає друге місце з приблизно 41,1 мільйона TEU, а Нінбо-Чжоушань — третє, вперше перевищуючи 40 мільйонів, до приблизно 43 мільйонів.
Чому Нінбо-Чжоушань називають найбільш завантаженим портом у світі, якщо Шанхай обробляє більше контейнерів?
Оскільки ці два порти вимірюють різні показники. Шанхай лідирує за обсягом контейнерних перевезень у TEU, тоді як Нінбо-Чжоушань лідирує за загальним вантажообігом у понад 1,4 мільярда тонн. Ця цифра включає наливні вантажі, такі як залізна руда, сира нафта та вугілля, які ніколи не транспортуються в контейнерах, і порт утримує це лідерство сімнадцятий рік поспіль. Для відправника контейнерів актуальним є рейтинг TEU.
Найбільш завантаженим контейнерним портом у Європі та Америці є?
Роттердам є найжвавішим контейнерним портом у Європі — приблизно 14,2 мільйона TEU у 2025 році, з Антверпен-Брюгге, що йде слідом. Лос-Анджелес є найжвавішим у Америці — близько 10,3 мільйона TEU за показниками 2024 року, посідаючи приблизно шістнадцяте місце у світі, що свідчить про те, наскільки більші провідні азійські хаби.