


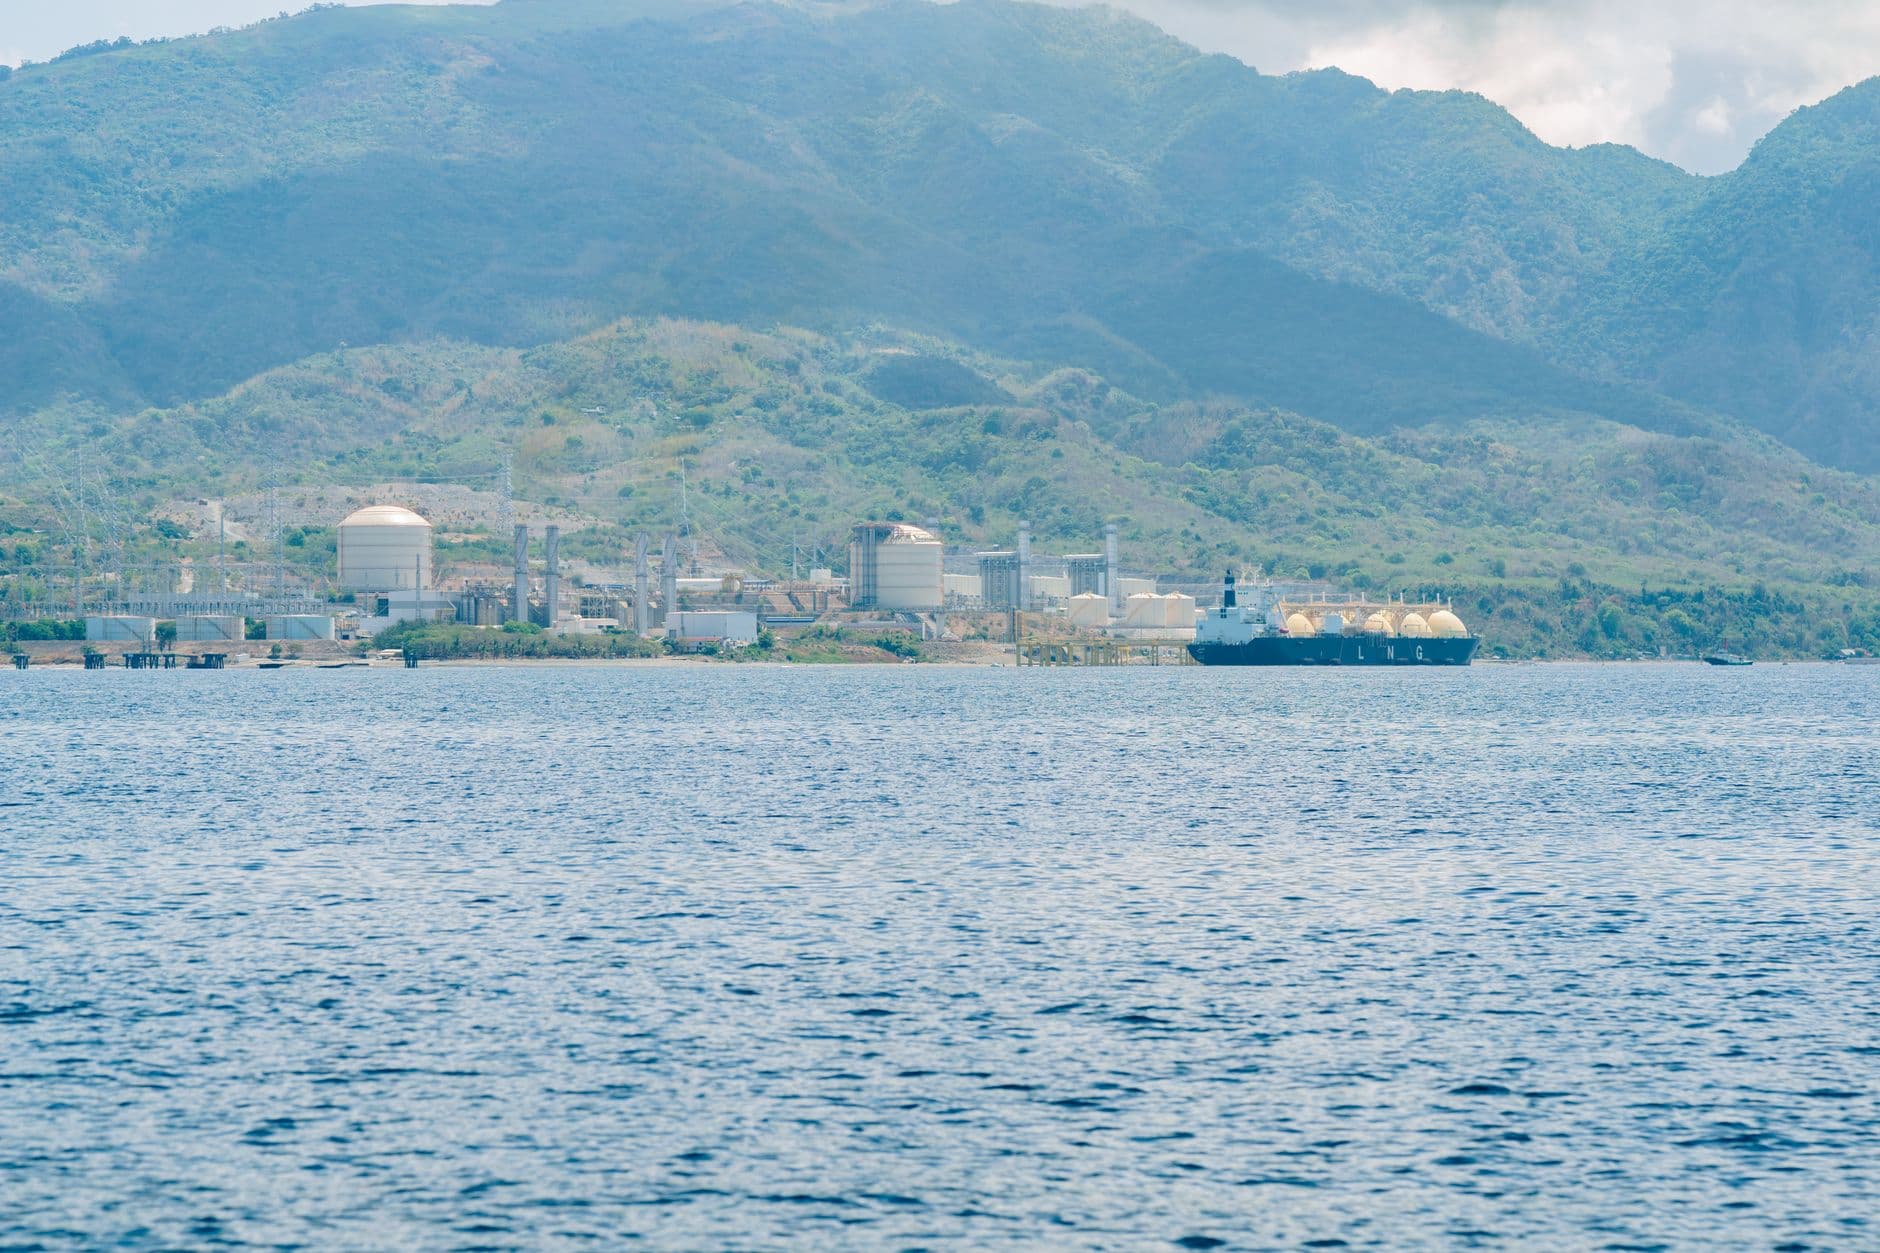

Το Ρας Λαφάν στο Κατάρ παραμένει η μεγαλύτερη μονάδα εξαγωγών ΥΦΑ στον κόσμο στα χαρτιά, με 14 μονάδες υγροποίησης. Πλήγματα με πυραύλους στις 18 και 19 Μαρτίου 2026 κατέστρεψαν τις Μονάδες 4 και 6, αξίας 12,8 εκατομμυρίων τόνων ετησίως, οπότε η μεγαλύτερη πλήρως διαθέσιμη μονάδα το 2026 είναι η Sabine Pass της Cheniere με περίπου 30 εκατομμύρια τόνους ετησίως.
Αυτό το χάσμα μεταξύ της ονομαστικής χωρητικότητας και της διαθέσιμης χωρητικότητας είναι ο λόγος που ξαναέφτιαξα αυτήν την κατάταξη αντί να αντιγράψω έναν πίνακα του 2025. Δύο από τις δέκα μεγαλύτερες μονάδες είναι πλήρως ή εν μέρει εκτός λειτουργίας από τον Αύγουστο του 2026, και το Freeport είναι μία από αυτές. Κάθε καταχώρηση παρακάτω δηλώνει τι μετράει ο αριθμός: ονομαστική χωρητικότητα, χωρητικότητα που είναι επί του παρόντος δυνατή για φόρτωση, ή χωρητικότητα που βρίσκεται ακόμη υπό κατασκευή.
Οι μεγαλύτεροι τερματικοί σταθμοί εξαγωγής ΥΦΑΕ το 2026
| # | Τερματικό | Χώρα | Χωρητικότητα | Βάση |
|---|---|---|---|---|
| 1 | Ρας Λαφάν | Κατάρ | 77,1 εκατομμύρια τόνοι ετησίως εθνική δυναμικότητα σε 14 γραμμές, περίπου 64,3 εκατομμύρια τόνοι ετησίως διαθέσιμοι μετά τις απεργίες του Μαρτίου 2026 | Πινακίδα, μειωμένη κατά 12,8 εκατ. τόνους ετησίως ζημιάς |
| 2 | Πέρασμα Sabine | Ηνωμένες Πολιτείες | Περίπου 30 εκατομμύρια τόνοι ετησίως από 6 αμαξοστοιχίες | Ονομαστική πινακίδα λειτουργίας |
| 3 | Μπιντουλού (MLNG) | Μαλαισία | 29,3 εκατομμύρια τόνοι ετησίως από 9 τρένα, κοντά στους 30 στο σύνολο του συγκροτήματος | Ονομαστική πινακίδα λειτουργίας |
| 4 | Corpus Christi | Ηνωμένες Πολιτείες | Πάνω από 25 εκατ. τόνους ετησίως τώρα, κατευθυνόμενοι προς 28,9 εκατ. τόνους ετησίως μόλις ολοκληρωθεί η Φάση 3. | Πινακίδα, επέκταση 93 τοις εκατό ολοκληρωμένη |
| 5 | Πλάκεμινς | Ηνωμένες Πολιτείες | 2,6 Bcf/ημερησίως ονομαστική, 3,2 Bcf/ημερησίως μέγιστη με πλήρη κατασκευή, περίπου 20 εκατομμύρια τόνοι ετησίως | Φάση 1 σε λειτουργία το 4ο τρίμηνο του 2026, Φάση 2 στα μέσα του 2027 |
| 6 | Χρυσό Πέρασμα | Ηνωμένες Πολιτείες | 18,1 εκατ. τόνοι ετησίως μέγιστο από 3 αμαξοστοιχίες | Πρώτη εξαγωγή φορτίου 22 Απριλίου 2026, ακόμα σε άνοδο |
| 7 | Γοργόνα | Αυστραλία | 15,6 εκατομμύρια τόνοι ετησίως από 3 γραμμές παραγωγής στο Barrow Island | Ονομαστική πινακίδα λειτουργίας |
| 8 | Ελεύθερη Ζώνη | Ηνωμένες Πολιτείες | Περίπου 15 εκατ. τόνοι ετησίως, εκτός λειτουργίας αυτή τη στιγμή | Διακόπηκε μετά από έκρηξη και φωτιά, επανέναρξη αναμένεται τέλη 2026 |
| 9 | Βόρεια Θάλασσα Shelf, Καρράθα | Αυστραλία | 14,3 εκατ. τόνους ετησίως μετά τη μόνιμη παύση λειτουργίας μιας δεύτερης μονάδας | Τρέχουσα ονομαστική ισχύς, μειωμένη από 16,7 |
| 10 | Κάμερον | Ηνωμένες Πολιτείες | 13,5 εκατομμύρια τόνοι ετησίως | Ονομαστική πινακίδα λειτουργίας |
Δύο δομικά στοιχεία βρίσκονται πίσω από αυτόν τον πίνακα. Έξι από τα δέκα εργοστάσια βρίσκονται στην ακτή του Κόλπου των ΗΠΑ, και η μοναδική μεγαλύτερη εγκατάσταση δεν είναι αμερικανική αλλά καταριανή. Τα εθνικά σύνολα είναι εκεί που οι δημοσιευμένες τιμές αποκλίνουν πιο έντονα. Οι Ηνωμένες Πολιτείες εμφανίζονται περίπου στα 102,3 εκατ. τόνους ετησίως σε ονομαστική βάση εξαγωγικής ικανότητας και στα 136,5 εκατ. τόνους ετησίως σε λειτουργική βάση στην αρχή του 2026, μια διαφορά 34 εκατ. τόνους ετησίως για την ίδια χώρα την ίδια χρονιά, επειδή ο υψηλότερος αριθμός πιστώνεται με τις μέγιστες αποδόσεις στα νέα εργοστάσια του Κόλπου. Από πλευράς ροών, η Υπηρεσία Πληροφοριών Ενέργειας τοποθετεί τις εξαγωγές των ΗΠΑ κοντά στα 17 δισ. κυβικά πόδια ημερησίως κατά μέσο όρο για το 2026.
Η Αυστραλία παρουσιάζει το ίδιο πρόβλημα σε μικρογραφία: 81,8 εκατομμύρια τόνοι ετησίως (mtpa) με εκτίμηση εξαγωγικής ικανότητας, 85,1 εκατομμύρια τόνους ετησίως (mtpa) σε 10 εγκαταστάσεις τον Φεβρουάριο του 2026, και πάνω από 87 εκατομμύρια τόνους ετησίως (mtpa) με πληρέστερο λειτουργικό υπολογισμό. Το Κατάρ βρίσκεται στα 77,1 εκατομμύρια τόνους ετησίως (mtpa) ονομαστικής ισχύος, με 12,8 από αυτά να μην είναι διαθέσιμα. Καμία από αυτές τις τιμές δεν είναι λανθασμένη, και δεν θα σύγκρινα έναν αριθμό από μια βάση με έναν αριθμό από μια άλλη.
Το Ρας Λαφάν έχασε δύο τρένα, και το ρολόι της επισκευής μετρά σε χρόνια
Οι επιθέσεις με πυραύλους στην Βιομηχανική Πόλη Ras Laffan έπληξαν τις Μονάδες 4 και 6, συνολικής δυναμικότητας 12,8 εκατομμυρίων τόνων ετησίως, καθώς και το εργοστάσιο Pearl GTL στην ίδια τοποθεσία. Ο Υπουργός Ενέργειας Saad Sherida Al-Kaabi εκτίμησε τον αντίκτυπο στο 17% της δυναμικότητας εξαγωγών LNG του Κατάρ και σε περίπου 20 δισεκατομμύρια δολάρια χαμένων ετήσιων εσόδων. Η QatarEnergy αναμένει οι επισκευές να διαρκέσουν 3 έως 5 χρόνια και κήρυξε ανωτέρα βία, με μακροπρόθεσμους αγοραστές στην Ιταλία, το Βέλγιο, τη Νότια Κορέα και την Κίνα να επηρεάζονται από μειωμένες παραδόσεις.
Για όσους σχεδιάζουν εμπορεύματα συνδεδεμένα με το φυσικό αέριο, η πρακτική συνέπεια είναι ότι αυτοί οι όγκοι μετακινούνται στην αγορά spot. Αυτός είναι ο μηχανισμός που έφερε φορτία από τις ΗΠΑ προς την Ευρώπη και την Ασία μέχρι την άνοιξη του 2026, και γι' αυτό η παραπάνω κατάταξη είναι ασταθής με έναν τρόπο που μια λίστα τερματικών σταθμών LNG κανονικά δεν είναι. Η απάντηση του Κατάρ είναι το North Field East, μια προσθήκη 32 εκατομμυρίων τόνων ετησίως (mtpa) που αρχικά προοριζόταν για λειτουργία το 2026 και τώρα αναφέρεται ότι θα καθυστερήσει για το 2027, ακολουθούμενη από το North Field South στα 16 εκατομμύρια τόνους ετησίως (mtpa) περίπου το 2028, στην πορεία προς περίπου 142 εκατομμύρια τόνους ετησίως (mtpa).
Η Sabine Pass γιόρτασε τα 10 της χρόνια και συνεχίζει να ηγείται του στόλου των ΗΠΑ
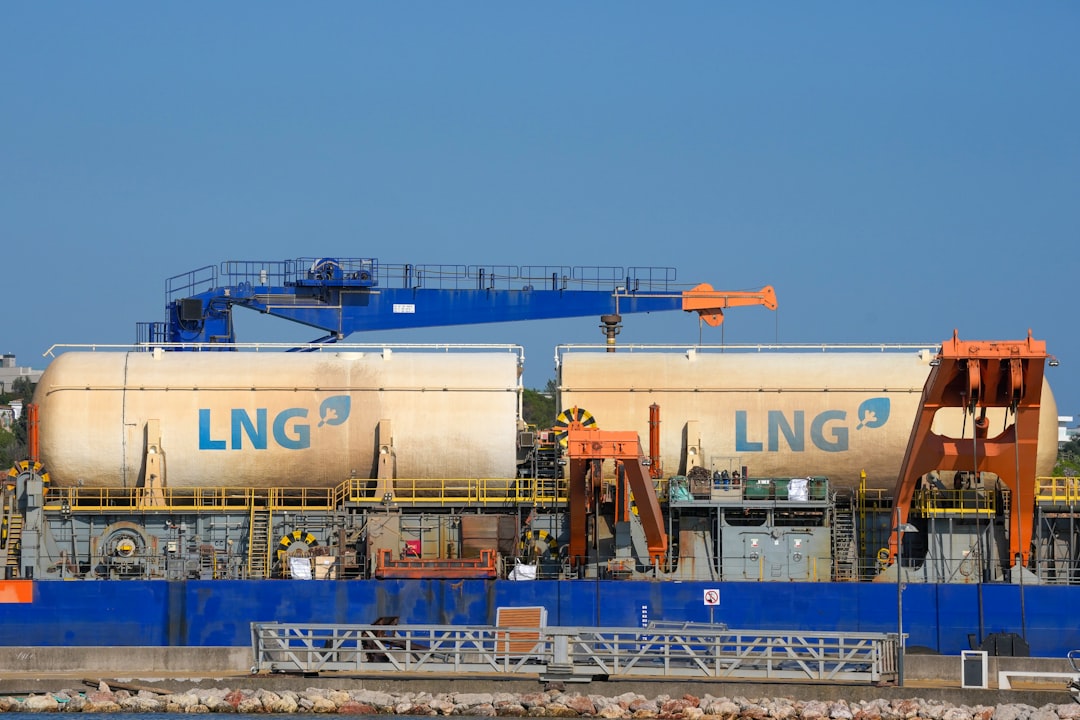
Το Sabine Pass έστειλε το πρώτο του φορτίο τον Φεβρουάριο του 2016, και 10 χρόνια αργότερα, τα 6 τρένα του, με χωρητικότητα περίπου 30 εκατομμύρια τόνους ετησίως (mtpa), το καθιστούν την άγκυρα του αμερικανικού εξαγωγικού όγκου. Δύο έργα αναμόρφωσαν την αμερικανική θέση κατά τη διάρκεια του 2026. Το Golden Pass, η κοινοπραξία QatarEnergy και ExxonMobil στο Sabine Pass του Τέξας, φόρτωσε το πρώτο εξαγωγικό του φορτίο στις 22 Απριλίου 2026 και έχει ονομαστική χωρητικότητα 18,1 mtpa στα 3 τρένα του. Το Plaquemines, η εγκατάσταση της Venture Global στη Λουιζιάνα και το όγδοο αμερικανικό εξαγωγικό τερματικό, παρήγαγε το πρώτο LNG τον Δεκέμβριο του 2024 και φτάνει τα 2,6 δισεκατομμύρια κυβικά πόδια την ημέρα (Bcf/d) ονομαστικά μόλις ολοκληρωθούν και οι δύο φάσεις, με την Φάση 1 σε λειτουργία το τέταρτο τρίμηνο του 2026.
Το Corpus Christi είναι ο τρίτος παραγωγός. Το στάδιο 3 ήταν 93% ολοκληρωμένο κατά τη διάρκεια του 2026 και ανεβάζει την τοποθεσία πάνω από 25 mtpa αμέσως, με 28,9 mtpa το νούμερο μόλις λειτουργήσει κάθε τρένο. Αυτές οι προσθήκες εμφανίζονται σε μηνιαία δεδομένα ροής αντί σε ετήσιους πίνακες χωρητικότητας. Οι εξαγωγές των ΗΠΑ έφτασαν σε ρεκόρ 11,7 εκατομμυρίων τόνων τον Μάρτιο του 2026, εκτιμώμενες σε 17,9 Bcf/d και ο δεύτερος υψηλότερος μήνας που έχει καταγραφεί, με την Ευρώπη να λαμβάνει το μεγαλύτερο μέρος. Οι εξαγωγές για ολόκληρο το έτος 2026 αναμένεται να αυξηθούν περίπου 13%.
Το Freeport είναι εκτός σύνδεσης, κάτι που οι πίνακες χωρητικότητας δεν δείχνουν
Η Freeport LNG, με δυναμικότητα κοντά στα 15 εκατομμύρια τόνους ετησίως (mtpa), σταμάτησε μετά από έκρηξη και πυρκαγιά, με την επανεκκίνηση να αναμένεται προς τα τέλη του 2026. Αυτή είναι η δεύτερη μεγάλη διακοπή λειτουργίας σε αυτή την κατάταξη εντός ενός έτους, και αφορά μια εγκατάσταση χωρίς εξήγηση πολεμικού κινδύνου πίσω από αυτήν. Η Freeport έχει ιστορικό απρόβλεπτων διακοπών, οπότε αντιμετωπίζω την ονομαστική της δυναμικότητα ως ανώτατο όριο παρά ως παραδοχή προμήθειας κατά την παροχή συμβουλών για τον χρονισμό των φορτίων.
Συνδυάζοντας τις δύο διακοπές, περίπου 28 εκατομμύρια τόνοι ετησίως (mtpa) ονομαστικής δυναμικότητας, Κατάρ και Αμερική, ήταν μη διαθέσιμη κάποια στιγμή το 2026. Συγκρίνετε αυτό με τα περίπου 300 mtpa που κατέχουν οι 3 μεγαλύτερες εξαγωγικές χώρες μαζί, και εξηγείται γιατί οι άμεσες τιμές παρέμειναν σταθερές σε μια χρονιά ρεκόρ εγκαταστάσεων.
Οι εμπορικοί φορείς βλέπουν τέτοιες διακοπές μέσα από διαφορετικά πρίσματα. Οι ασφαλιστές τιμολογούν την έκθεση σε διακοπή επιχειρηματικής δραστηριότητας, οι αγοραστές εξετάζουν τις ρήτρες εκτροπής στις συμφωνίες πώλησης, και οι πλοιοκτήτες παρακολουθούν εάν τα υποκατάστατα φορτία παρατείνουν τα ταξίδια με έρμα. Μια διακοπή στην ακτή του Τέξας, επομένως, αναδιατάσσει την αριθμητική ναύλωσης πολύ πέρα από τον Κόλπο, και το κύμα φτάνει σε θέσεις ελλιμενισμού που δεν διαχειρίζονται καθόλου αέριο.
Το Bintulu είναι το φυτό που ξεχνούν οι περισσότερες κατατάξεις
Η Petronas υγροποιεί αέριο στο Bintulu του Sarawak από τη δεκαετία του 1980, και το συγκρότημα λειτουργεί τώρα 9 μονάδες με 29,3 εκατομμύρια τόνους ετησίως, μετά την προσθήκη 3,6 εκατομμυρίων τόνων ετησίως από τη Μονάδα 9 στα προηγούμενα 25,7 εκατομμύρια τόνους ετησίως. Αυτό την τοποθετεί εντός 0,2 εκατομμυρίων τόνων ετησίως από το Sabine Pass, καθιστώντας τη δεύτερη και τρίτη θέση ένα θέμα στρογγυλοποίησης παρά μια πραγματική ιεραρχία. Θεωρώ και τις δύο ως συν-επιλαχούσες του Ras Laffan όταν συμβουλεύω για το πού υπάρχει βιώσιμη ικανότητα φόρτωσης εκτός της λεκάνης του Ατλαντικού.
Η Αυστραλία ανταγωνίζεται με βάση τον αριθμό των φυτών, όχι το μέγεθος των φυτών
Η Αυστραλία έφτασε στη δεύτερη θέση ανά χώρα χωρίς να κατέχει ούτε μία εγκατάσταση κλίμακας Κατάρ ή Λουιζιάνας. Ο Βορειοδυτικός Όρμος (North West Shelf) στην Κάραθα, που λειτουργεί από το 1989, ανέρχεται πλέον σε 14,3 εκατομμύρια τόνους ετησίως (mtpa) μετά την οριστική απόσυρση ενός δεύτερου τρένου αντί απλώς να τεθεί σε αδράνεια, κάτι που αποτελεί πραγματική μείωση από τα 16,7 εκατομμύρια τόνους ετησίως (mtpa) που αναφέρουν παλαιότεροι πίνακες. Το Gorgon στο Barrow Island προσθέτει 15,6 εκατομμύρια τόνους ετησίως (mtpa) από 3 τρένα που αντλούν από τα κοιτάσματα Gorgon και Jansz-Io. Το υπόλοιπο της εθνικής δυναμικότητας κατανέμεται σε 8 επιπλέον εγκαταστάσεις, κάτι που παρουσιάζει διαφορετικό προφίλ κινδύνου: καμία μεμονωμένη απεργία ή διακοπή λειτουργίας δεν αφαιρεί το ένα έβδομο της εθνικής παραγωγής, αλλά καμία μεμονωμένη εγκατάσταση δεν προσφέρει την ευελιξία φόρτωσης του Ras Laffan.
Τι χωρητικότητα τερματικού σταθμού λέει και τι δεν λέει σε έναν ναυλωτή
- Η πλάκα ονόματος είναι ένα σχέδιο. Τα τρένα κινούνται πάνω ή κάτω από αυτήν ανάλογα με τη θερμοκρασία περιβάλλοντος, τη σύνθεση του αερίου τροφοδοσίας συν τους κύκλους συντήρησης, οπότε μια μονάδα 15,6 εκατομμυρίων τόνων ετησίως δεν αποτελεί υπόσχεση για 15,6 εκατομμύρια τόνους ετησίως.
- Ο αριθμός των θέσεων καθορίζει τον ρυθμό φόρτωσης. Δύο προβλήτες σε μια μονάδα 30 εκατομμυρίων τόνων ετησίως δημιουργούν μια πολύ διαφορετική ουρά από τέσσερις προβλήτες στην ίδια χωρητικότητα.
- Οι ανωτέρω βίαιες αιτίες μετακινούν το φορτίο, όχι τη χωρητικότητα. Όταν το Κατάρ το δήλωσε, ο τόνος δεν εξαφανίστηκε από την αγορά· αντικαταστάθηκε από πιο μακρινές περιοχές, γεγονός που παρέτεινε τα ταξίδια και περιόρισε την προσφορά πλοίων.
- **Η δυναμικότητα υπό κατασκευή δεν είναι δυναμικότητα.** Η Φάση 2 του Plaquemines αναμένεται στα μέσα του 2027, και το North Field East έχει ήδη μεταφερθεί από το 2026 στο 2027.
- Οι απρόβλεπτες διακοπές δεν είναι σπάνια γεγονότα. Το Freeport, με δυναμικότητα περίπου 15 εκατομμυρίων τόνων ετησίως, είναι εκτός λειτουργίας αναμένοντας επανεκκίνηση στα τέλη του 2026, και κανένας πίνακας δυναμικότητας που δημοσιεύθηκε τον Ιανουάριο δεν θα το είχε εμφανίσει.
- Η πολιτική γεωγραφία είναι μέρος του αριθμού. Η Yamal LNG συνεχίζει τις εξαγωγές υπό την πίεση των κυρώσεων, με τα περισσότερα φορτία να πηγαίνουν στην Ασία τους καλοκαιρινούς μήνες, ενώ το σχετικό έργο Arctic LNG 2 έχει ουσιαστικά μπλοκαριστεί.
Αν μετακινείτε φορτίο που σχετίζεται με αέριο αντί για το ίδιο το αέριο, η χρήσιμη ένδειξη είναι η διάρκεια του ταξιδιού. Η αντικατάσταση του όγκου από το Κατάρ από τον Κόλπο του Μεξικού προσθέτει ναυτικά μίλια, και τα πρόσθετα ναυτικά μίλια απορροφούν πλοία. Είδαμε τον ίδιο μηχανισμό ανάποδα όταν άλλαξε η διαδρομή της Ερυθράς Θάλασσας, την οποία κάλυψα στο Οδηγός δρομολόγησης διώρυγας Σουέζ και Ερυθράς Θάλασσας. Η πλευρά του στόλου αυτής της αγοράς παρουσιάζεται στην κατάταξή μας του μεγαλύτερες εταιρείες μεταφοράς ΥΦΑ, και το ζήτημα της διέλευσης από τον Κόλπο αντιμετωπίζεται στο Οδηγός παράκαμψης Στενού του Ορμούζ.
Συνήθεις ερωτήσεις
Ποιος είναι ο μεγαλύτερος τερματικός σταθμός εξαγωγής ΥΦΑ παγκοσμίως το 2026; Ο Ras Laffan στο Κατάρ, βάσει δυναμικότητας σχεδιασμού, με 77,1 εκατ. τόνους ετησίως σε 14 μονάδες. Μετά τις απεργίες του Μαρτίου 2026 που αφαίρεσαν 12,8 εκατ. τόνους ετησίως, είναι διαθέσιμα περίπου 64,3 εκατ. τόνοι ετησίως, και η μεγαλύτερη εγκατάσταση που είναι άθικτη και σε λειτουργία είναι η Sabine Pass με περίπου 30 εκατ. τόνους ετησίως.
Ποια μεγάλα εργοστάσια τίθενται εκτός λειτουργίας τον Αύγουστο του 2026; Δύο. Οι μονάδες Ras Laffan Trains 4 και 6, αξίας 12,8 εκατομμυρίων τόνων ετησίως, αντιμετωπίζουν επισκευές 3 έως 5 ετών, και το Freeport, περίπου 15 εκατομμυρίων τόνων ετησίως, έχει διακοπεί μετά από έκρηξη και πυρκαγιά με αναμενόμενη επανεκκίνηση στα τέλη του 2026. Μαζί, αυτό αντιστοιχεί σε περίπου 28 εκατομμύρια τόνους ετησίως ονομαστικής παραγωγικής ικανότητας.
Πόσο καιρό θα μείνουν εκτός λειτουργίας οι κατεστραμμένες αμαξοστοιχίες του Κατάρ; Η QatarEnergy ανέφερε 3 έως 5 χρόνια. Οι αμαξοστοιχίες 4 και 6 είναι οι δύο επηρεαζόμενες μονάδες, και ο χειριστής δήλωσε ανωτέρα βία για τις επηρεαζόμενες μακροπρόθεσμες συμβάσεις αντί να προσπαθήσει να τις καλύψει από αλλού στο συγκρότημα.
Είναι οι Ηνωμένες Πολιτείες πλέον ο μεγαλύτερος εξαγωγέας ΥΦΑ; Με βάση την ικανότητα, ναι, και στις δύο βάσεις: 102,3 εκατομμύρια τόνοι ετησίως ονομαστική ή 136,5 εκατομμύρια τόνοι ετησίως λειτουργική στις αρχές του 2026, έναντι άνω των 87 εκατομμυρίων τόνων ετησίως για την Αυστραλία και 77,1 εκατομμυρίων τόνων ετησίως για το Κατάρ. Οι εξαγωγές του Μαρτίου 2026 ύψους 11,7 εκατομμυρίων τόνων ήταν μηνιαίο ρεκόρ, και οι όγκοι αναμένεται να αυξηθούν κατά περίπου 13% καθ' όλη τη διάρκεια του έτους.
Γιατί οι αριθμοί χωρητικότητας τερματικών σταθμών διαφέρουν μεταξύ πηγών; Επειδή μια πηγή μετρά την ονομαστική χωρητικότητα, μια άλλη μετρά τι μπορούν να φορτώσουν αυτή τη στιγμή τα τρένα, και μια τρίτη προσθέτει έργα που αναμένονται εντός 18 μηνών. Η Αυστραλία εμφανίζεται στο 81,8, 85,1, καθώς και πάνω από 87 mtpa ακριβώς για αυτόν τον λόγο, και οι Ηνωμένες Πολιτείες στο 102,3 ή 136,5. Αναφέρω τη βάση για κάθε αριθμό παραπάνω, ώστε η σύγκριση να παραμένει δίκαιη.
Πηγές: Δηλώσεις της QatarEnergy για τη ζημιά στο Ras Laffan τον Μάρτιο του 2026, δεδομένα εξαγωγών και χωρητικότητας από την Υπηρεσία Ενεργειακών Πληροφοριών των ΗΠΑ (US Energy Information Administration), δηλώσεις φορέων εκμετάλλευσης από Cheniere, Venture Global, Golden Pass, Petronas, Woodside και Chevron. Τα στοιχεία χωρητικότητας είναι ονομαστικής αξίας, εκτός αν αναφέρεται διαφορετικά, και αλλάζουν καθώς οι μονάδες τίθενται σε λειτουργία ή εκτός λειτουργίας.