


Adopt a shared information platform linking shippers, ports, customs, and trucking partners to synchronize schedules and cut dwell time.
Use levers such as pre-booked berths, staged vessel calls, and controlled gate queues to reduce bottlenecks. Track imports and align inventory across warehouses and the house of distribution to prevent skewed stock levels that stall loading windows. Monitor data in real time to respond to changes in vessel arrivals and commodity mix.
There has been a surge in demand from Asia, with china accounting for a large share of new volumes. The most audible signal is longer container dwell times at key hubs, however, the effect can be softened by early planning and smarter booking. Businesses in marketing and operations should coordinate to smooth cross-border flows rather than reacting after queues form.
To accelerate customs clearance, provide standardized information packets with accurate data on SKU, container number, and port of origin. This reduces significant delays and frees up staff to process other shipments. However, keep a sharp eye on compliance; consistent data saves time and lowers demurrage charges in the busiest months.
Inventory visibility across warehouses and markets lets executives plan better and avoid overstock in the house. A simple rule: move from reactive to proactive by forecasting lead times and securing flexible slots with carriers. This approach yields measurable effect on throughput, especially during peak seasons.
Leverage cross-functional teams to implement the changes quickly. The industrys that began piloting integrated platforms report reductions in queue times and cost per TEU. There is no single fix; success comes from combining data, people, and levers across the supply chain. Start with a 90-day pilot to test the approach and scale thereafter.
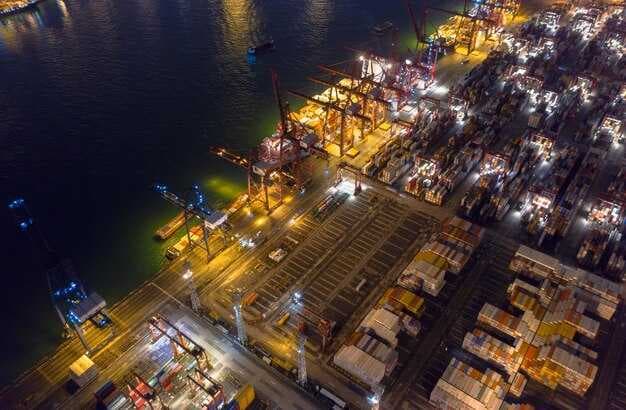
Tackling Port Congestion: Practical Insights for Global Trade and the Economic Impact
Extend weekends operating hours at a key facility to accelerate freight movement, allowing trucks to move during off-peak windows. This decades-long underinvestment has been announced by port authorities, and the shift became an operational step to reduce contact and congestion on busy docks.
To speed throughput, terminals should rely on technologies such as AI-driven yard management, automated cranes, and cross-docking; this combination improves operational performance while supporting sustainability, facility throughput, and faster handling of freight.
Establish shared data exchanges with shipping lines, freight forwarders, and foreign partners to align schedules in real time; during the pandemic years, port networks already learned the value of contact and contactless coordination, enabling ports to stay closely coordinated even when volumes spiked.
Smart planning leads to greater throughput, reducing the time ships wait at gates and improving berth utilization. The main bottlenecks often occur at gates and yards; targeting these areas with better scheduling, weekends coverage, and real-time alerts can reduce the last mile delay and help shipments move efficiently.
Implement a two-year rollout: pilot at two to three facilities to prove the model, then scale across the network in successive years. Each step relies on shared data, standardized KPIs, and a clear contact protocol with foreign carriers; already 12-18 months of testing can yield measurable gains in dwell times, ever improving as data accumulates.
By integrating sustainability into every step, ports gain a greater resilience, allowing global trade to function with steadier costs and smoother flows. The industrys benefit from a framework that pairs technologies, data-sharing, and aligned planning, reducing last mile delays and increasing predictability for foreign shippers and consumers alike. This approach helps communities recover from shocks more quickly, and ports do not stand alone when disruptions occur, drawing on cross-border collaboration and shared best practices.
Root causes, indicators, and practical actions to reduce port bottlenecks
Recommendation: implement a nationwide, shared data platform that connects employees, brokers, carriers, and terminal operators to synchronize arrivals, yard activity, and vessel calls.
Root causes
- Fragmented data across geographies and terminals causes delays as capacity reaches its limit.
- Inconsistent scheduling and poor yard visibility create longer dwell times for goods; insufficient investments in automation and workforce planning raise bottlenecks.
- Limited coordination among carriers and trucking activity slows arrivals; real-time updates are sporadic, leaving terminals idling.
- Equipment and IT infrastructure lack regular health checks; outages interrupt live operations.
- Regulatory or documentation friction adds manual steps and errors, increasing rework and queues.
- Skilled staff shortages across shifts reduce productive hours; fatigue and turnover undermine throughput and satisfaction.
- Thoughtful scenario planning and risk assessments reveal single points of failure that cascade across geographies.
Indicators
- Average dwell time per container at gates and within yards
- Berth occupancy rate and quay crane productivity
- Gate queue length and gate-out dwell times
- Container stack density and inland transit times
- Carrier on-time performance and broker communication latency
- Labor utilization and shift coverage in critical tasks
- System health: IT uptime and equipment reliability
- Shipper and broker satisfaction scores from regular surveys
- Geographies reach and nationwide capacity alignment metrics
Practical actions
- Establish a clear agreement among port authorities, mayor offices, terminal operators, carriers, and brokers defining data sharing, headways, and performance targets.
- Roll out a common data standard and real-time feeds from computer systems to a single dashboard accessible nationwide; implement privacy and security controls.
- Invest in pre-clearance and appointment systems that reduce waiting times by aligning carriers and drivers with gate slots; aim for fewer idle hours per day.
- Automate yard planning and crane moves with sensors and intuitive dashboards; these investments raise throughput and keep assets healthy.
- Strengthen workforce planning: cross-train employees, implement versatile shift coverage across ports, and publish live staffing forecasts; monitor satisfaction and throughput gains.
- Enhance engagement with brokers and carriers: establish regular status updates and a unified reply protocol; ensure team members can read the latest updates to stay aligned.
- Expand geographies coverage by linking additional gateways to the data hub so disruptions do not cascade nationwide; involve local stakeholders like Jones-led teams and community groups.
- Implement proactive equipment health checks and rapid recovery playbooks; maintain redundant networks to minimize outages that stall activity.
- Deploy real-time performance dashboards and weekly trend reports; publish a simple scorecard that all stakeholders can read and act on.
- Offer incentives for on-time vessel calls and container departures; tie rewards to measurable KPIs in the agreement.
- Pilot the approach at select ports with teus volumes to validate processes before broader rollout; adapt based on lessons learned.
- Communicate progress to local communities through the mayor and regional partners; reinforce health and safety standards for workers and neighbors.
Saying: fewer touches and clearer agreements accelerate flow, aligning greater activity with needs across geographies and beyond. This approach serves carriers, brokers, and employees alike, raising satisfaction and live data visibility for read updates and continuous improvement.
Quantifying the economic costs of congestion: delays, demurrage, and lost turnover
Starting with a one-page cost model that captures three cost streams: delays, demurrage, and lost turnover, and refresh it monthly. Link the numbers to your organization’s orders and activity data, and keep the page maintained by the chief logistics officer. The starting text on this page should be clear and actionable, helping teams avoid hitting targets that no longer reflect running conditions.
Delays generate value-at-risk in two channels: cargo tied in transit and slower downstream activity. Somewhere in the data, dwell time is the dominant driver of lost turnover. For example, a hub handling imports worth $1.5B per month with 4% of shipments experiencing delays averaging 2 days yields a lost turnover of roughly 0.04 × (2/30) × 1.5B ≈ $4.0M per month. If that delay rate drops from 4% to 3% or the average delay falls by 0.5 days, the monthly change in losses is about $1.0–1.5M, a meaningful visible improvement for the organization.
Demurrage costs accrue when cargo sits beyond free time. A practical scenario: 600 containers delayed 4 days at $150 per container per day produce $360,000 in demurrage. Rates differ widely by port, contract, and container type, so run a monthly “what-if” by adjusting the per-day charge in your model. Quick wins come from tightening with agreements that cap charges, enabling pre-clearance, and streamlining yard handling through dedicated equipment.
Lost turnover measures revenue impact from late deliveries and stockouts. For example, if 5% of orders arrive late and each late order reduces revenue by 3%, with monthly turnover of $2B, lost turnover ≈ $3M. Track this alongside delays and demurrage to show how congestion translates into customer outcomes. Starting with conservative assumptions and refining them as data arrive keeps the picture realistic and useful.
To drive down these costs, focus on three levers: maintain equipment to reduce breakdowns, tighten agreements to cap charges and shorten free time, and optimize the system that links port, carrier, and inland movements. Ensure imported activity and arrived cargo feed into the model, so the monthly view stays current. If disasters or other disruptions hit, a pre-defined response minimizes the momentary impact on orders and turnover, while preserving service levels. The changes should be visible across the organization, not buried in a long presentation, so the team can act while performance is still changing.
Measuring key congestion indicators: vessel wait times, crane productivity, and yard occupancy
Establish a single KPI suite and publish a weekly dashboard that tracks vessel wait times, crane productivity, and yard occupancy across ports. Tie data to a plan approved by the national authority and supported by policy discussions. This approach reduces uncertainties that slow decisions and gives leaders and workers a clear view of where to focus efforts that year.
-
Vessel wait times
- Definition: time from vessel arrival at the first anchorage or pilot pickup to first berth occupancy. Capture timing by port, carrier, and cargo type to reveal variations that impact throughput.
- Metrics to track: median wait, 75th percentile, 95th percentile, and daily distribution. Report by shift and by day of week to surface timing bottlenecks that vary across port hours.
- Targets and timing: set year-long targets that reflect proven improvements in similar ports. Use a rolling 7‑day window to smooth out anomalies and give a true read on progress (that year’s plan should include contingency steps for peak periods).
- Data sources and verification: pull from the authority’s berthing records, port logs, and ship-operator feeds. Validate with interviews from workers and terminal managers to confirm true delays vs. data gaps.
- Actions to reduce wait: extend gate hours, align pilot and tug services, and adjust berthing windows based on forecasted traffic. Share forecasted timing with retailers so they can plan dockside flow and reduce dwell on land that would otherwise block yard space.
-
Crane productivity
- Definition: moves per crane hour, average cycle time (grab, lift, rotate, lower, release), and crane utilization rate. Break out by crane group and shift to spot underperforming assets.
- Key metrics: throughput per crane hour, number of moves per hour, percentage of uptime, and downtime causes (maintenance, weather, congestion).
- Targets and timing: aim for steady year-over-year gains in moves/hour and reduce cycle time by a chosen percentage. Track improvements monthly and compare against last year’s baseline to confirm progress.
- Data sources and verification: combine crane control system logs with terminal operation dashboards. Cross-check with crew interviews to validate operational conditions affecting productivity.
- Actions to boost output: optimize crane schedules, align with yard plan, and pre-stage containers to minimize idle time. John or other policy leads can push for standard maintenance windows to keep fleet ready.
-
Yard occupancy
- Definition: percentage of yard capacity occupied by containers at rest, plus dwell time for inbound and outbound units. Break occupancy by area (land side, inland stacks) and by container type.
- Metrics to track: occupancy rate, average dwell time, average turn time per container, and gate-to-gate flow metrics. Monitor peak occupancy periods and reversals after vessel discharge.
- Targets and timing: maintain occupancy below a safe threshold (for example, under a defined percentage) while ensuring quick clearance for new arrivals. Review quarterly with planners, retailers, and authority teams to adjust space use and stacking rules.
- Data sources and verification: pull yard sensors, gate logs, and terminal WMS data. Validate with interviews from yard workers to capture bottlenecks not visible in automated data.
- Actions to optimize space: reallocate stacks by destination or carrier, accelerate outbound flows, and pilot managed transloads to free critical lanes. This supports steady operations and reduces the chance of gridlocks in the yard.
Data governance and timing matter. Use a single source of truth, with a clear data dictionary, agreed timing (for example, daily reads by 08:00 local time, weekly reviews by policy teams), and a mechanism for rapid updates when facts shift. Interviews with workers and retailers help confirm timing patterns and uncover uncertainties that numbers alone miss; theyre a vital complement to dashboards. In practice, leadership from figures like garcetti has highlighted the need for true collaboration among ports, land-side operators, and national planners to keep plans aligned with house and land logistics. When data reveals gaps, the plan should adapt quickly and reflect the true conditions on the ground, including tariff volatility and external shocks that can affect timing and capacity. By maintaining steady data flow, authorities can act on the chance to grow efficiency, reduce dwell, and improve operate performance across the supply chain.
- Publish a weekly KPI report that compares current week to the same week last year, with commentary on variances and requests for actions from the responsible leader.
- Schedule monthly reviews with retailers and workers to discuss findings from interviews and data correlations, ensuring theyre informed and engaged in continuous improvement.
- Implement a phased plan to scale the data sharing framework nationally, starting with pilot ports, then expanding to cover all major gateways.
Forecasting congestion with real-time data: metrics to monitor and prompt responses
Start with a centralized real-time data hub that ingests vessel positions, berth status, truck ETAs, gate counts, and weather. Define a small set of main metrics and automate prompts when they reach planned thresholds; this prevents a sudden backlog and keeps land operations smooth. For perishable goods, rapid signaling protects those deliveries and reduces dollars tied to delays.
Monitor metrics such as berth occupancy, ETA variance, dwell time at gates, crane productivity, yard occupancy, truck turn, fuel consumption, and the rate of container landings. Track trend lines to recognize patterns that indicate capacity strain, including sudden spikes or declines. Maintain a decades-long record of thresholds and responses to inform plans shared with the facility leader and those responsible for manufacturing and logistics.
When thresholds are exceeded (for example, high occupancy or ETA variance), trigger automated alerts to the mayor, the facility leader, and those responsible for plans. Reassign planned resources, open alternate berths, and adjust lane and yard layouts to keep the main flow moving and avoid a sudden backlog. In difficult conditions, a fast, data-driven response reduces service gaps and keeps costs in dollars in check.
Assign a cross-functional owner: the leader of operations, the head of manufacturing, and the data team. Those interested in the numbers can review dashboards from the facility and across the network. terry, the data analyst, maps signals to actions and documents outcomes in the record kept for future planning. The goal: keep land flow running smoothly and make congestion a predictable, low-cost event rather than a crisis.
Share lessons at conferences and in internal reviews to refine plans, align funding and incentives, and heighten accountability across departments. Those who manage facilities, fleets, and manufacturing should track the financial impact in dollars and adjust investments accordingly. The result: high confidence in the forecast, a smoother handover between shippers and carriers, and reduced dwell time at the main hubs.
By building a frictionless loop with real-time signals, ports can convert data into actions that land more shipments on time, protect the supply of perishable goods, and keep costs under control. For terry and those at the center of plans, the focus is on ongoing improvement, clear accountability, and a view that measures and feedback loops endure for decades-long records.
Berthing and yard optimization: scheduling, resource allocation, and process improvements
Implement a dynamic berthing window policy linked to yard readiness and quay crane availability, and align yard stacking with ship calls to cut mean dwell time by 20% within six weeks.
Schedule in 15-minute blocks and apply just-in-case buffers of 10–20 minutes for high-variance calls. Keep a steady cadence across the page and browser-based dashboard to inform the team.
Allocate resources by district and area; assign dedicated gantry cranes to lanes with the highest order volume and keep the workforce cross-trained to swap tasks rapidly. Learnings from singapore and sacramento show how to scale, and plan a phased upgrade of the yard operating system for the future. Leverage sustainability goals to guide daily operations and call out how true data supports continuous improvement.
Standardize handoffs between berthing, yard, and inland transport. Deploy a browser-based dashboard to display berth occupancy, crane moves, and yard status, and issue a concise command during daily talks with the association. Maintain a deep focus on data quality to drive reliable decisions.
In a recession scenario, keep nearly six weeks of coverage and adjust orders flow; if volumes couldnt absorb all initial calls, shift yard space and staff to high-utility tasks to minimize idle lanes and preserve service levels for remaining orders.
| Metric | Current | Target | Action |
|---|---|---|---|
| Berth utilization | 72% | 85% | Dynamic scheduling; renegotiate near-term calls |
| Yard turnover time | 3.8 days | 3.2 days | Slot allocation; re-slotting |
| Crane moves per hour | 12 | 15 | Staging lanes; dedicated crane teams |
| Dwell time per container | 2.4 days | 1.8 days | Pre-staging; rapid handoffs |
| Yard density | 70% capacity | 85% | Area zoning; cross-docking |
| Rework rate | 6% | 2% | Procedure standardization; error-proofing |
Streamlining inland links: rail, trucking, and last-mile coordination to ease port pressure
Adopt a unified inland plan that routes 60% of containerized freight to intermodal lines and locks in docking windows at major terminals by Q3 2025. Create a shared schedule across rail, trucking, and last-mile providers, with synchronized turn times and a text-based notification system that keeps all actors in open communication and improves logistics visibility. Coordinate the inland links with only the most cost-effective trucking lanes when rail capacity is constrained.
In the angeles district, align truck routes with rail hubs to shuttle shipments from coastal docking lanes to inland yards, beyond coastal areas. Build intermodal yards near retailers to shorten land travel and maintain steady freight flow; include fueling points at inland hubs to keep fleets moving and support predictable replenishment cycles.
Avoid shut bottlenecks by diversifying corridors; pandemic shocks showed the risk of single-path flows, so plan buffers, reserve slots, and use cross-docking at terminals. Never rely on a single corridor; give priority to intermodal options to increase resilience.
Experienced operators note that similar inland corridors stay on track when a steady communication loop links yards, terminals, and carriers, and they have earned reliability by maintaining disciplined line management.
Given market volatility, district authority can mandate common standards for dock-to-yard handoffs, while terminals share live freight data with retailers to improve forecast accuracy and inventory planning. march data show seasonal peaks in inland movements, reinforcing the need for flexible slots and contingency agreements.
This approach creates an opportunity to cut dwell time, reduce congestion, and strengthen resilience across supply chains.