


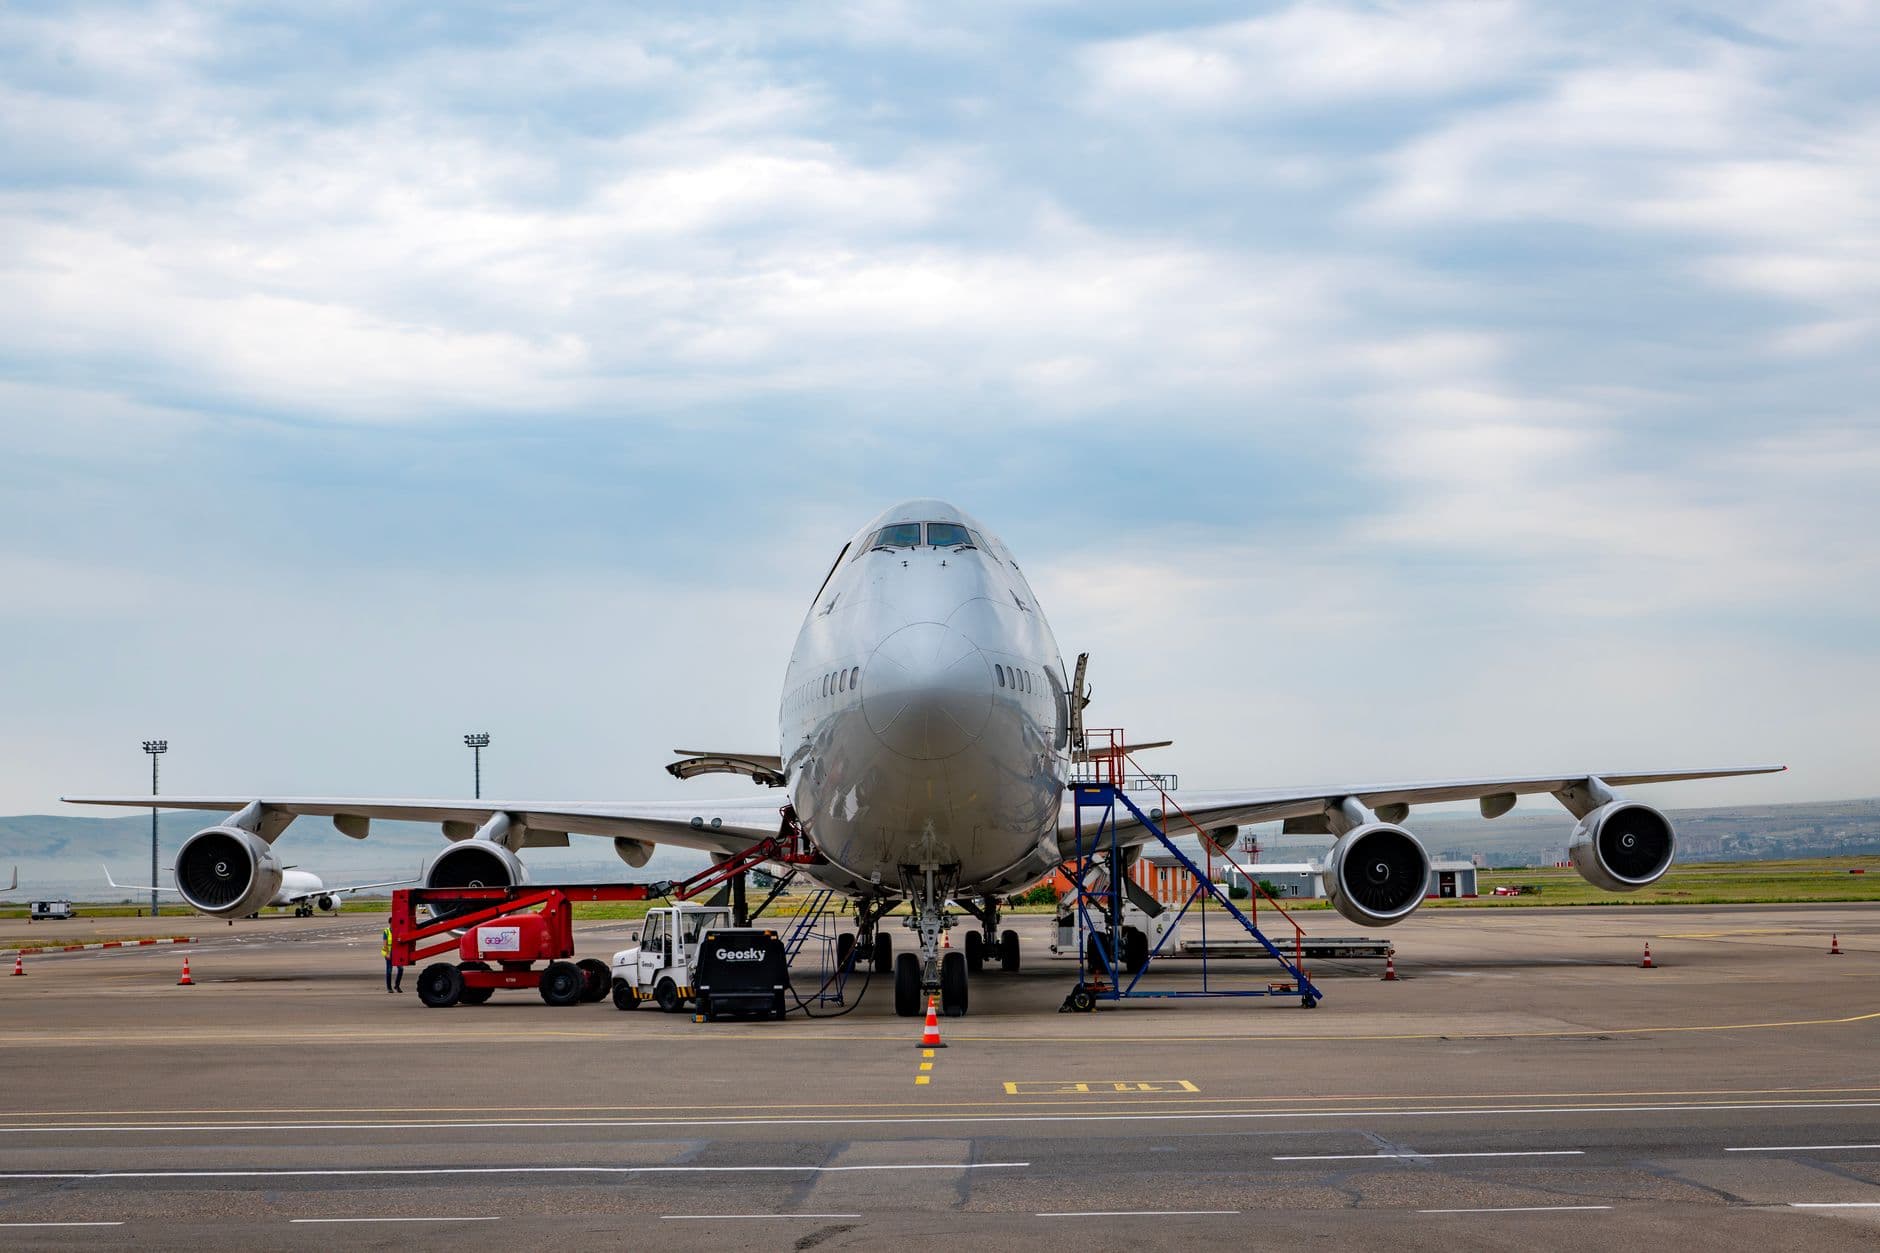

Air cargo rarely flies point to point. Most of what we ship by air passes through one or two major hubs, where it is sorted, consolidated, sometimes refuelled, and handed to the next aircraft long before it reaches the destination city on the airway bill. That routing detail matters more than most shippers expect. The hub your freight transits sets your realistic lead time, the capacity you can actually book in a peak week, and how many handling touches your pallet picks up on the way. At GetTransport.com we route air freight across these gateways every week, so when the yearly ranking of the world's busiest cargo airports lands, we read it as a map of where capacity concentrates rather than a leaderboard to admire. Here is the 2026 picture, drawn from ACI World's preliminary 2025 figures, and what it means for the cargo you need to move.
The 2025 ranking, and where the numbers come from
The reference set most of the industry works from is the ACI World preliminary 2025 cargo ranking, released in April 2026. According to ACI World, global air cargo volumes reached almost 128.9 million tonnes in 2025, up about 2.9% year over year and roughly 8.8% above the pre-pandemic 2019 baseline. That is a market still growing, if unevenly, and the growth is not spread across every airport equally. The busiest gateways keep pulling in a disproportionate share of the tonnage.
Concentration is the headline. ACI World figures show the 10 busiest cargo airports handling close to 26% of all airport cargo traffic worldwide. Shipco Transport, reporting on the same data, puts the top 20 at roughly 42% of the global total. In other words, fewer than two dozen airports move something close to half of what flies. For a shipper that means the odds are high that your freight already routes through one of these nodes, whether your forwarder names it on the quote or not.
| Rank | Airport (IATA) | Role and notes | 2025 tonnes (ACI World, preliminary) |
|---|---|---|---|
| 1 | Hong Kong (HKG) | Asian mega-gateway; manufacturing and transshipment | about 5,070,256 |
| 2 | Shanghai Pudong (PVG) | Mainland China export gateway | about 4,090,000 |
| 3 | Anchorage (ANC) | Transpacific refuelling and transfer super-hub | about 3,900,000 |
| 4 | Louisville (SDF) | UPS Worldport; climbed to 4th in 2025 | per ACI World |
| 5 | Miami (MIA) | Latin America gateway; up about 13.6% in 2025 | per ACI World |
| 6 | Memphis (MEM) | FedEx super-hub; slipped to 6th in 2025 | per ACI World |
| 7-10 | Incheon (ICN), Dubai (DXB), Taipei (TPE), Guangzhou (CAN) | Seoul gateway, long-haul transfer, and a rising China hub closing the top ten | per ACI World |
| 11-20 | Tokyo Narita (NRT), Doha (DOH), Los Angeles (LAX), Frankfurt (FRA) | Long-haul transfer and regional gateways | per ACI World |
We show exact tonnage only where ACI World's preliminary release confirmed it, and the ranks follow the 2025 preliminary order. That order moved this year: Louisville's UPS hub climbed to fourth, Miami jumped about 13.6% into fifth on the back of Latin American trade, and Memphis slipped to sixth, while Guangzhou pushed into the top ten. Positions from seventh down still shuffle as freighter schedules and trade lanes shift, so we treat them as indicative rather than fixed.
Why Hong Kong keeps the crown
Hong Kong International held the number one spot again in the 2025 ranking, at about 5,070,256 metric tonnes. Per ACI World, that is the fifteenth time HKG has topped the cargo table since 2010, a run of dominance no other airport comes close to matching. The reason is partly geography and partly infrastructure. Air Cargo News notes that HKG can reach roughly half the world's population within a five-hour flight, which puts most of Asia's manufacturing belt and consumer base inside a single overnight rotation.
For the forwarders and shippers we work with, that reach translates into booking depth. When an airport sits at the centre of that many trade lanes, there are more flights, more freighter frequencies, and more room to recover when one departure is full. A hub with thin frequency leaves you waiting for the next available aircraft, and in a peak week that wait can add days.
Anchorage and the airports that exist to transfer freight
Anchorage sits at number three in the ACI World ranking, and it is worth understanding why an airport in Alaska ranks above most of the world's capital cities. ANC is a transpacific refuelling and transfer super-hub. Freighters flying between Asia and North America stop there to top up fuel and, increasingly, to swap or re-sort loads. The airport earns its tonnage not because Alaska generates freight but because so much freight passes through on its way somewhere else.
This is where a real operator lesson lives. Every transfer hub adds a handling touch. When a container transships at a node like Anchorage, it is unloaded, staged, and reloaded, and each of those steps is another point where a shipment can be delayed or a package damaged. We do not treat that as a reason to avoid transfer hubs. Often the routing that runs through one is faster and cheaper than a thinner direct option. But we price the extra touch into the risk conversation with the shipper rather than pretending it is not there.
Integrator super-hubs versus passenger-belly gateways
The ranking makes a distinction that shippers rarely see on a quote. Some of these airports are integrator super-hubs built around a single express carrier. Memphis is the FedEx super-hub. Louisville is the UPS Worldport. These are sorting machines engineered so that one company controls the aircraft, the ground handling, and the network schedule end to end. The 2025 data even flipped their order, with Louisville edging ahead of Memphis, a reminder that these hubs rise and fall on express-network volume rather than local demand.
That control changes reliability, and it is one of the clearest patterns we see. When we route time-critical cargo through an integrator hub, the whole chain sits under one operator, so a missed connection is that operator's problem to solve, not a handoff between two companies pointing at each other. Route the same shipment through a passenger-belly gateway, where cargo rides in the hold beneath travellers, and you inherit the passenger schedule. If the airline cancels a route or downgauges to a smaller aircraft, your belly capacity shrinks with it, and no one on the passenger side is thinking about your pallet. Neither model is universally better. Integrator networks tend to win on predictability, while belly and mixed gateways such as Incheon or Frankfurt often win on price and lane coverage.
Belly versus freighter capacity, and why it moves your lead time
The split between belly capacity and freighter capacity is the mechanism behind most of the lead-time surprises shippers hit. Belly capacity is the cargo space in the hold of a passenger aircraft. It is cheap when the passenger network is dense, but it is a byproduct of a schedule set by ticket sales, not by cargo demand. Freighter capacity is dedicated. It exists to move goods, and it holds up when passenger demand wobbles.

This is why the same origin and destination can behave differently depending on the hub in the middle. A gateway with heavy freighter frequency keeps moving your cargo when belly space evaporates, which is exactly what happens in the fourth-quarter peak or during a disruption. A belly-dependent gateway looks fine on a normal Tuesday and then locks up the moment demand spikes. We plan around this by leaning on freighter-heavy hubs when a shipment cannot slip, and by treating belly-heavy routings as the value option that carries schedule risk. If you want the fuller mechanics of how this plays into pricing, our note on air freight rates and capacity in 2026 walks through the numbers.
How e-commerce and the end of de-minimis are reshaping the flows
The other force bending these rankings is cross-border e-commerce. For years, low-value parcels moved in enormous volume under de-minimis rules that let small shipments cross borders with minimal duty and paperwork. As major markets have tightened or removed that treatment, the economics of shipping millions of individual low-value parcels by air have shifted, and so have the flows that fed several of the busiest Asian gateways.
We would flag this as a developing story rather than a settled statistic. The directional reporting from trade press including Air Cargo News points to e-commerce reorganising where volume lands, with some of it consolidating into fewer, larger air-freight movements and some of it shifting toward ocean and sea-air routings. What we are not going to do is quote a precise percentage swing, because the 2025 ACI World data captures a market mid-transition and any single-source figure on the parcel shift should be treated with caution. For a shipper, the practical read is that a lane which was cheap and fast on e-commerce economics two years ago may price and route differently now, and the hub that anchored it may be handling a different mix of freight.
What the ranking changes about how we route your cargo
Read as an operating map, the 2025 ranking clusters into three kinds of node. There are the Asian mega-gateways led by Hong Kong and Shanghai Pudong, where manufacturing volume originates. There are the North American express hubs like Memphis and Louisville, built around integrator networks. And there are the strategic long-haul transfer airports, Anchorage foremost among them, that exist to move freight between the other two. Knowing which kind of node a routing leans on tells us most of what we need to know about its risk and its cost.
Here is how we put that to work when we quote a shipment:
- For deadline-critical freight, we favour integrator super-hubs where one carrier owns the whole chain, accepting a higher rate for tighter predictability.
- For cost-sensitive freight with schedule slack, we will accept a belly-gateway or transfer-hub routing, and we tell the shipper where the extra handling touch or capacity risk sits.
- In peak season we shift toward freighter-heavy hubs before belly space tightens, rather than after.
None of this replaces getting a firm booking. But it explains why two quotes for the same origin and destination can differ by days and dollars, and it is the same logic we apply to sea freight when we map the busiest ocean shipping routes. The hub in the middle is doing more work than the endpoints, and it deserves a look before you commit.
Frequently asked questions
Which is the world's busiest cargo airport in 2026?
Hong Kong International (HKG) tops the ACI World preliminary 2025 ranking released in April 2026, at about 5,070,256 metric tonnes. Per ACI World, it is the fifteenth time HKG has led the cargo table since 2010. Shanghai Pudong (PVG) ranks second at about 4.09 million tonnes and Anchorage (ANC) third at roughly 3.9 million.
Why does the airport my freight transits change my lead time?
Because the hub determines whether your cargo rides on dedicated freighters or in passenger belly space, and how many transshipment touches it takes. A freighter-heavy hub keeps moving goods when passenger belly capacity tightens in peak weeks, while a transfer hub such as Anchorage adds a handling step that can affect both timing and damage risk.
How much of global air cargo runs through the top airports?
ACI World figures indicate the 10 busiest cargo airports handle close to 26% of global airport cargo traffic, and Shipco Transport reporting puts the top 20 at roughly 42%. Global air cargo reached almost 128.9 million tonnes in 2025, up about 2.9% year over year per ACI World.