




Recommendation: hedge planning by accelerating near-term bookings and diversifying slot usage to cushion against delays on the cross-Pacific sea corridor linking america with suppliers and customers. This significant disruption risk can create an effect on flow, so act now to protect cost and performance.
In this cycle, carriers report growing demand from the asia-europe corridor and rising costs; however, the flow of containers to america remains tight, with delays concentrated at west coast gateways and key hubs. Overall volumes are down some 4-6% over last period, while average dwell times rose by 2-3 days, causing a shock to service calendars. Yet there are pockets where growth appears, particularly on asia-europe routes that feed transloads to inland markets.
Theme resilience requires strategies that focus on buffer stock, alternative routes, and responsive scheduling. The current disruptions in major hubs led to partial relief, but new port handling restrictions created additional delays. emissions intensity improved where speed reductions offset empty repositioning, yielding a net cost saving, especially for high-utilization lanes.
Where to act: optimize flow by prioritizing high-value commodities, deploying spot buys to manage volatility, and aligning with growth in the asia-europe channel. Some carriers have started to build longer-term contracts with alliances to smooth service across the cycle, which reduces cost volatility and improves reliability by up to 5-7% in active lanes. This responsive approach supports steady growth across markets.
Takeaway: monitor events and adjust strategies to keep america-bound flow balanced. A balanced mix of rerouted services, inventory buffers, and some diversification across geographies supports stability as volumes recover. The ongoing theme remains that just in time decisions will minimize cost shocks and support growth across routes including asia-europe and other allied corridors.
Transpacific Ocean Freight Updates
Recommendation: lock capacity now for the upcoming window and align with your truck partners to prevent last-mile bottlenecks. When planning, secure service commitments from at least two carriers, and build a buffer of 10–14 days to absorb variability.
Alphaliner data shows a growing trend toward fewer void movements, with cancelled slots easing and utilization improving. The latest cycle reveals voids down to 12 on the core corridors, from 18 in the prior run, and earliest departures advancing by roughly 3 days.
Some shippers redirected volumes to secondary routes, boosting intermodal pickup and inland trucking demand. This keeps cargo moving, but peak windows still stretch lead times in field hubs. The newsletter highlights continued import momentum, with volumes up on key gateways but with higher port dwell.
Response from carriers indicates resilience; Matt from the insights desk confirms continued coverage pressure easing, yet volatility persists during peak periods. Alphaliner notes that cancellations remain manageable, though some itineraries still cancelled when terminals hit capacity.
heres the plan to implement now: 1) diversify routing across two corridors, 2) set alert thresholds for voided slots and cancelled occurrences, 3) align inland trucking windows with port arrivals, 4) monitor the Alphaliner feed and adjust as needed, 5) subscribe to our newsletter for updates. This approach helps you weather shifting schedules and protect service levels, и analyze patterns назад to refine future decisions.
Week 19 Carrier Breakdown and Schedule Changes
Recommendation: secure alternative capacity on european lanes now; this offsets skipped asia-europe routes and reduces idle containers amid the pandemic, назад to pre-pandemic norms.
The period reveals how shifts followed a clear pattern: where demand remains stable, capacity targets moved toward european corridors, with contracts adjusted to avoid overexposure on disrupted lanes.
| Carrier | Route | Original schedule | Current change | Idle containers (TEU) | Rate impact | Notes |
|---|---|---|---|---|---|---|
| stinson | asia-europe | Originally ETA 22 days | Shift +4–6 days; skipped on some loops | 520 | −8% | Happening amid capacity contraction; drops observed on certain lanes; follows new contract terms |
| Maersk | asia-europe | Originally ETA 23 days | Shift +2 days; some sails idle | 760 | −4% | European-led reallocation; where demand remains steady, some loads redirected |
| CMA CGM | asia-europe | Originally ETA 21 days | Current changes +3 days; certain trades paused | 680 | −5% | Contract renegotiations in play; asia-origin volumes slipping; routes adjusted |
| Hapag-Lloyd | asia-europe | Originally ETA 20 days | Idle on several sails; drops observed | 410 | −7% | Skips on select lanes; amid pandemic effects |
Result: the mix shows a deliberate shift toward european corridors where possible, with a moderate rate relief offset by longer transit times on some itineraries. The changes were followed by decreased utilization on high-risk lanes and increased emphasis on contractual flexibility, which is essential to maintain service continuity on amid-market disruptions. In this context, routes from asia-europe exhibit the most pronounced adjustments, while european-adjacent trades stabilize as carriers reallocate capacity to balance throughput and reliability.
Impact on Lead Times, Availability, and Booking Windows

Lock bookings early and diversify routings to stabilize rates and reduce their volatility for time-sensitive shipments. Secure capacity across multiple ports and near-dock handoffs to trim costs, that keeps the whole shipment predictable and minimizes last-minute truck surcharges. Favor specific lanes with reliable service to blunt disruptions.
Lead times extend when disruptions hit key hubs. Dwell at origin typically 1–3 days and at destination 2–5 days, with teus sometimes longer due to gate queues and vessel scheduling, or delayed by weather. Build buffers into whole shipments and plan for 15–30 day horizons to absorb variability, using teus as a common capacity metric.
Set booking windows by specific lanes and secure capacity 15–30 days ahead, adjusting for port events and seasonal patterns. Diversify to nearby ports to reduce risk and maintain service levels; ensure your teams support moving containers efficiently to truck or rail for on-time delivery. Coordinate with suppliers and carriers for the next available slots when primary routes show congestion.
Shifts toward intermodal moves can cut carbon and lower certain costs; like scheduled handoffs that minimize dwell, compare door-to-door options and favor those that reduce idle time. For high-value or time-sensitive cargo, lock in allocations early to avoid price spikes and detours that hurt margins; this approach works across the century of rapid logistics change.
Join a webinar to digest disruptions, port calendars, and upcoming events. Rely on timely data rather than anecdote to set expected windows; this approach yields certain results in planning and helps teams align on next steps for bookings, ports, and container counts in teus.
Asia-to-US Routes: Lane Performance and Capacity Trends
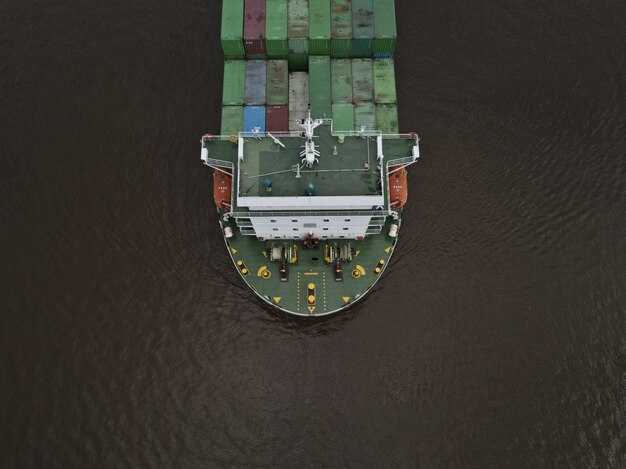
Lock bookings in advance of the next scheduling window to stabilize rate and ensure available equipment, aligning with Maersk and other operators to secure steady TEUs across this corridor.
Lane performance shows West Coast routes carrying the majority of throughput, with volumes turning to 110,000–130,000 teus weekly across primary legs. The Los Angeles–Long Beach chain and Busan–LB segment account for a large share. Equipment availability is improving, and operators are deploying shared containers and multiple schedules to sustain this throughput; as a result, cost per TEU remains favorable when utilization stays high and schedules stay well aligned. Drewry’s latest reading reveals rate firmness as bookings climb, which means carriers can preserve margins while shippers lock in capacity through forward-looking programs.
Maersk and other operators have turned to flexible schedules and equipment-sharing programs that support reliable service. The Stinson and Kendall readings show volumes across multiple origin points turning into steadier bookings and improved utilization, with this pattern holding before the peak season. In practice, this means enhanced reliability for customers who diversify their supplier roster and connect to intermodal legs, supported by these trends in maritime logistics.
To maximize resilience, pursue a mix of carriers, leverage this data-driven view of volumes and schedules, and negotiate forward commitments with pricing that reflects the tight equipment balance. The result will be lower cost per TEU over time and more predictable arrivals, helping shippers maintain service levels even as demand adjusts; this demonstrates how the means of these programs and multiple partnerships deliver value on the Asia-to-US corridor.
Actionable Guidance for Shippers: Inventory, Booking, and Routing Adjustments
Lock in capacity now by rebook with maersk on priority inland corridors for the next 6–8 weeks, especially for apparel categories, which turned higher demand into observed tightness, to safeguard lead times and stabilize landed costs.
Inventory planning: Maintain a regional buffer of 4–6 weeks for high-velocity items, with category splits to reduce dwell and avoid capital being tied to slow movers. For apparel, target a 6-week on-hand max in inland hubs and coordinate cross-dock options to improve velocity around receiving windows.
Booking strategy: Centralize critical bookings in a single portal and backfill with tentative holds to avoid void; reallocate capacity by flow from low-demand to high-demand lanes; use multiple carriers when possible to mitigate disruptions. Monitor bookings vs. demand by category; ensure updates are shared with procurement teams.
Routing adjustments: Route through inland hubs and alternative ports to minimize dwell at origin/destination; adjust layovers to align with inland delivery windows; consider phased routing for large apparel orders with two to three hubs, which reduces chained delays across the chains.
Rates and charges: Track rate movements and related charges with a year-over-year lens; set target limits and trigger alerts if a leg moves beyond 12% within a month. For a total of around 1.2 million units, negotiate bundled rate cards with maersk and partner carriers to lock in stable costs and minimize price spikes, while comparing regional rates to select the best option.
Emissions and sustainability: Favor inland moves with lower emission profiles; consolidate shipments to reduce emissions per unit; the article notes that sustained improvements in routing can lower emissions across the chains. Updates followed by davissupply help set targets for the future cycles.
Inactive capacity and supplier alignment: Audit partner networks for inactive lanes; align with davissupply updates to stay current; avoid extended inactivity by planning rebook cycles in advance; ensure contracts reflect minimum volumes to secure space.
Disruptions mitigation: Build a playbook for disruptions with pre-approved alternatives; maintain a flexible schedule; though disruptions persist, resilient routing helps overcome disruptions and reduces downstream impact; track late deliveries and allocate buffer time to protect commitments.
Categories overview and performance: Use a category-driven approach; track apparel, electronics, home goods, and other high-turnover groups; for each category, compare current bookings to year-over-year baselines and adjust inventory and routing to avoid oversupply or stockouts; around 1.2 million units in the current cycle require targeted action.
Future planning and actions: Set a quarterly review cadence to compare updates from maersk with internal demand signals; determine which routes delivered stable dwell and fewest voids to scale; ensure the theme of efficiency is embedded in supplier negotiations and inbound planning.
Additional Resources: Data Feeds, Reports, and Contacts
Recommendation: Connect your planning dashboard to a daily data feed and a monthly digest. This keeps operations aligned, supports rebook decisions, and helps importers respond decisively when capacity tightens. Informa data, followed by Drewry insights, reveals how the average service level is evolving, with terminal congestion growing in several hubs since the year began. Use a well‑curated pile of signals to build a simple strategy: reach critical thresholds, trigger alerts, and run scenario analyses. Some signals are happening now, so automate early warnings and integrate them into your guardrails.
Data Feeds
- Daily terminal status, berth availability, yard activity, and equipment updates from Informa and Drewry, with dwell times and gate movements.
- Real-time vessel ETA changes and capacity alerts, including drops in space and schedule disruptions that inform rebook decisions.
- Congestion indices and trend data by hub, showing where reliability is growing or slipping.
- Alerts tied to defined thresholds (e.g., ETA shifts >6 hours, dwell time >5 days) to support decisive actions.
Reports
- Monthly market snapshot covering capacity utilization, service reliability, and cost pressure, with sources from Informa and Drewry.
- Rebooking trend analysis highlighting windows when space becomes more available, helping importers time changes and avoid being stuck.
- Congestion and dwell-time report showing where the pile of signals points to bottlenecks, plus year‑over‑year comparisons to track progress since year start.
- Scenario planning sheets that translate signals into actionable steps for operations and procurement teams.
Contacts
- Informa Data Desk: access via client portal; inquiries to [email protected]
- Drewry Analyst Relations: market insights desk; inquiries to [email protected]
- Operations Support: terminal and carrier network liaison; inquiries to [email protected]
- Account Liaison: regional logistics lead for your region; inquiries to regional-support@example