


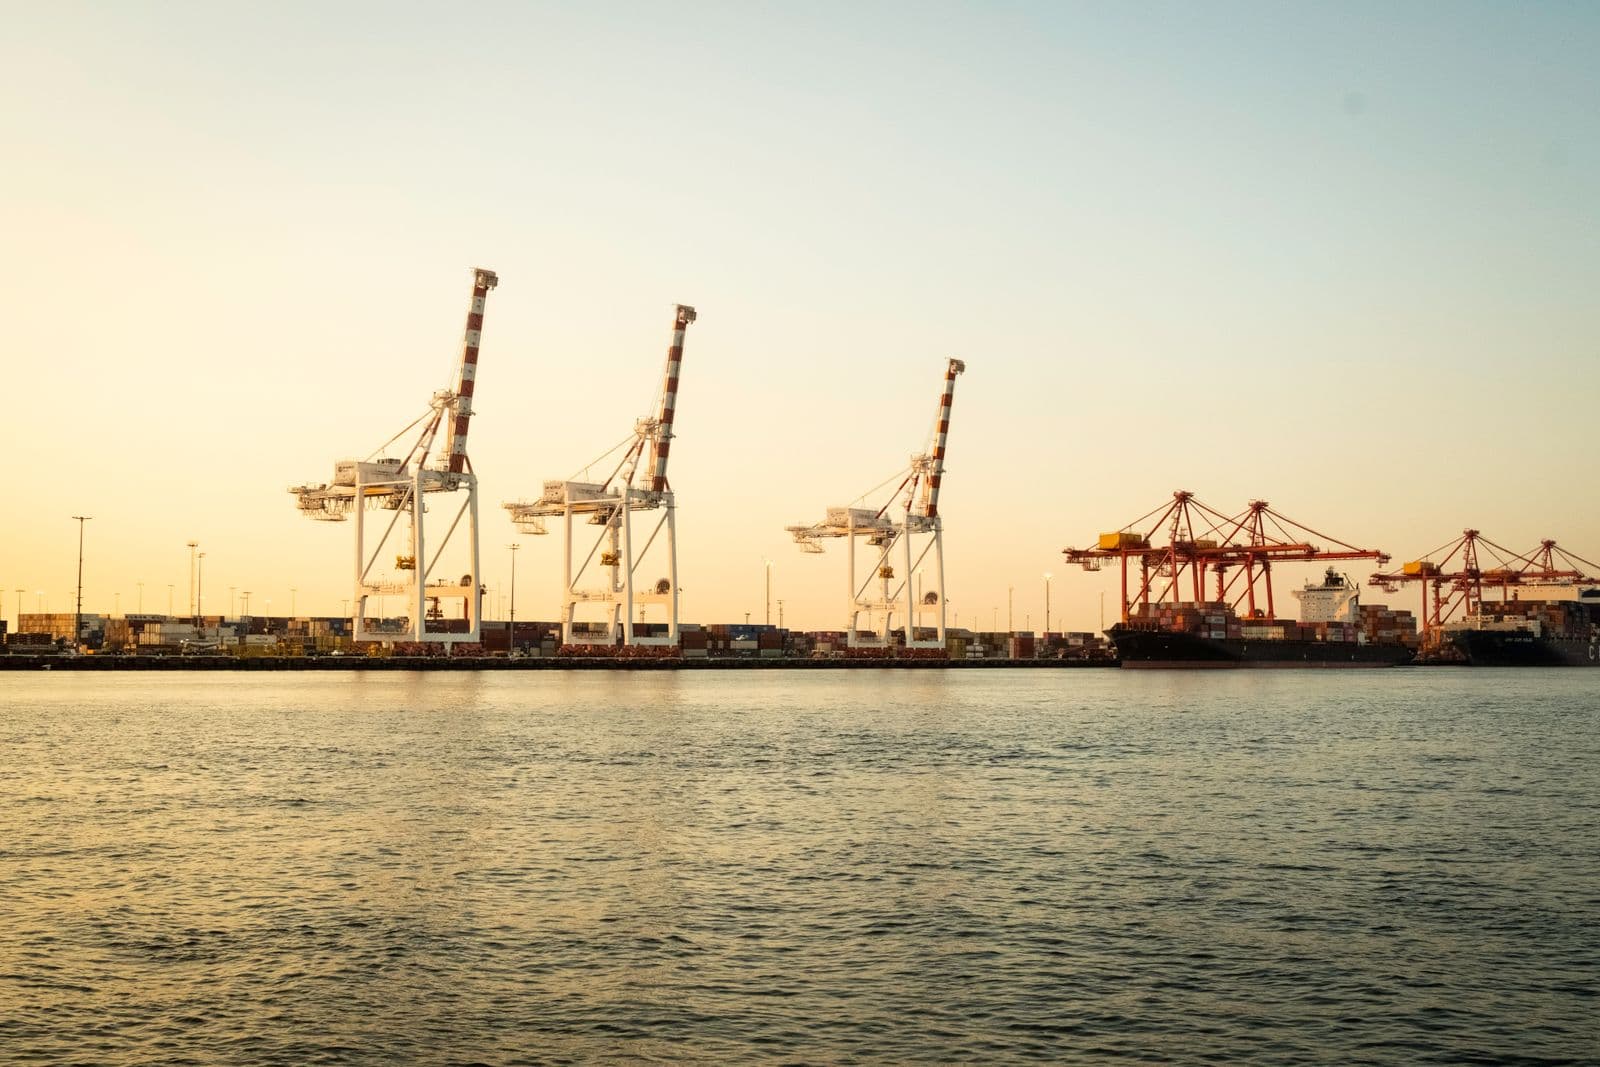

يحتوي بحر البلطيق على اقتصادين مينائيين داخل بحر واحد. لا تزال المحطات الروسية تسجل أعلى أرقام الحمولة، مدفوعة بالنفط الخام والمنتجات، بينما تستحوذ الموانئ البولندية والليتوانية على نمو الحاويات. ترتيب حسب الكتلة وترتيب حسب الصناديق ينتج قائمتين مختلفتين تمامًا، وقد وسع عام 2026 الفجوة مرة أخرى.
لقد وضعت هذه الطاولة معًا لأنني كنت أرى باستمرار تصنيفات بحر البلطيق التي تخلط بين حمولات عام 2025 وأعداد الحاويات لعام 2023 وتسمي النتيجة حالية. فيما يلي أرقام السنة الكاملة لعام 2025 حيث نشرتها الموانئ، والنصف الأول من عام 2026 حيث كان ذلك مهمًا، وملاحظة واضحة في كل مرة يكون فيها الرقم تقريبيًا بدلاً من ما تم الإبلاغ عنه.
مرتبة حسب حمولة الشحن، 2025
| منفذ | 2025، مليون طن | سنة بعد سنة، نسبة مئوية | الملف الشخصي |
|---|---|---|---|
| أو soyka-luga ، روسيا | 130.5 | -3.4 | النفط الخام، المنتجات، الفحم، الغاز الطبيعي المسال |
| غدانسك، بولندا | 80.4 | +4.0 | وقود، حاويات، فحم |
| بريمورسك، روسيا | 63.9 | +5.2 | خام ومنتجات |
| ميناء سان بطرسبرغ الكبير | 54.6 | +3.0 | مختلط، حاويات |
| غوتنبرغ، السويد | حوالي 40 | صناديق التسجيل | حاويات، رورو، طاقة |
| كلايبيدا، ليتوانيا | 39.0 | سنة التسجيل | حاويات، رورو، أسمدة، غاز طبيعي مسال |
| شيتسين وشوچينويشتشه | 34.79 | +7.5 | غاز طبيعي مسال، سائب، عبّارات، حاويات |
| روستوك، ألمانيا | حوالي 32 | شقة | عبّارات، رورو، بضائع سائبة |
| غدينيا، بولندا | 25.7 | -4.4 | حاويات، رو-رو، حبوب |
| ريغا، لاتفيا | 16.8 | -7.0 | بضائع عامة، بضائع سائبة |
| تالين، إستونيا | 13.8 | +5.0 | رو-رو، ركاب، سوائل سائبة |
| هلسنكي، فنلندا | 13.4 | مستقر | رو-رو، حاويات، ركاب |
| فنتسبيلس، لاتفيا | 8.53 | +3.6 | المحتوى السائب، المحتوى السائب السائل |
إدخالان في هذا الجدول تقريبيان وأفضل أن أذكر ذلك بدلاً من التظاهر بخلاف ذلك. تنشر جوتنبرج تفاصيل الحاويات و ro-ro بسهولة أكبر من رقم إجمالي واحد للوزن، ويبلغ وزنها السنوي حوالي 40 مليون طن. أفادت روستوك عن 32.2 مليون طن في عام 2023 و 16.5 مليون طن بحلول منتصف عام 2025، مما يضعها ضمن رقم سنوي مماثل. كل شيء آخر في العمود هو رقم سنوي معلن عنه بالكامل.
مرتبة حسب الحاويات، ويتغير الترتيب
| منفذ | 2025، وحدة مكافئة لعشرين قدمًا | سنة بعد سنة، نسبة مئوية | النصف الأول من عام 2026، حاوية مكافئة لعشرين قدمًا |
|---|---|---|---|
| غدانسك | حوالي 2,800,000 | +23 | حوالي 1,600,000 |
| كلايبيدا | 1,308,687 | +22 | ما يقرب من 700,000 |
| غدينيا | فوق 1,000,000 | +5.27 | لم يُنشر بعد |
| غوتنبرغ | 934,000 | +4، رقم قياسي | 226,000 في الربع الأول، -2.6 |
غدانسك هي الرائدة في حاويات بحر البلطيق، وليس بفارق ضئيل: تعاملت محطاتها مع ما يقرب من 2.8 مليون حاوية قياسية (TEU) في عام 2025، منها 2,766,475 مرت عبر Baltic Hub وحدها، مع ارتفاع حمولة الحاويات بنسبة 18 بالمائة لتصل إلى 24 مليون طن. في النصف الأول من عام 2026، رفعت الموانئ إجمالي الشحن بنسبة 9 بالمائة إلى 41.7 مليون طن، مع قرب الحاويات من 1.6 مليون حاوية قياسية (TEU).
كلايبيدا هي الأسرع نمواً من حيث النسبة المئوية. فقد أغلقت عام 2025 بسعة 1,308,687 حاوية قياسية (TEU)، بزيادة 22 بالمئة عن رقمها القياسي السابق، وشحنات الحاويات بلغت ما يقرب من 13 مليون طن، بزيادة 29 بالمئة. وخلال النصف الأول من عام 2026، تعاملت مع ما يقرب من 700,000 حاوية قياسية (TEU) بإنتاجية حاويات بلغت 7.2 مليون طن، بزيادة 12 بالمئة، وكانت الميناء البلطيقي الرئيسي الوحيد الذي حقق نمواً في إجمالي حجم الشحنات خلال نصف العام، مما رفع حصتها من سوق موانئ دول البلطيق إلى 44 بالمئة.
لماذا يختلف الجدولان بهذه الطريقة الكبيرة
تتصدر أوست-لوغا قائمة الحمولة بـ 130.5 مليون طن ولا تظهر في مناقشة الحاويات، لأن الغالبية العظمى من إنتاجيتها سائل وصابورة جافة. أضف بريمورسك وسانت بطرسبرغ، وتشكل الموانئ الروسية الثلاثة في بحر البلطيق ما يقرب من 249 مليون طن، أي أكثر من جميع الموانئ البولندية والليتوانية واللاتفية والإستونية في الجدول مجتمعة. تعاملت الموانئ البحرية الروسية ككل مع 884.5 مليون طن في عام 2025، بانخفاض قدره 0.4 بالمائة.
لا تتطابق هذه الكمية مع الأهمية التجارية لمعظم قراء هذا الموقع. لا يمكن للمستورد الأوروبي حجز حاوية في محطة خام. ما يخبرك به عمود الحمولة هو أماكن تركيز التجريف، الإرشاد، وحمولة التصنيف الجليدي. ما يخبرك به عمود TEU هو أماكن تفريغ صندوقك فعليًا. لقد شاهدت فرق المشتريات تختار بوابة في البلطيق من تصنيف الحمولة ثم تكتشف أن الميناء الذي اختاروه لديه رافعة حاويات واحدة.
يختلف اتجاه السفر لعام 2026 أيضًا. انخفضت التحميلات في أوست-لوغا وبريمورسك بنسبة 10 بالمائة و 9 بالمائة على التوالي في يونيو 2026، بينما سجلت غدانسك وكلايبيدا نموًا في النصف الأول. إن فرض العقوبات والاحتكاك التأميني وأنظمة التفتيش تفعل لحجم الصادرات الروسية عبر بحر البلطيق ما لم يتمكن أي منافس تجاري من تحقيقه في 20 عامًا.
خسرت لاتفيا اقتصاد عبور، وكسبت ليتوانيا واحدًا
القصة الهيكلية الأكثر حدة في هذا البحر هي لاتفية. انخفض الشحن بالسكك الحديدية عبر لاتفيا إلى 3.58 مليون طن في النصف الأول من عام 2026، بانخفاض 18.7 بالمائة عن نفس الفترة من عام 2025، وانكمشت أعمال العبور في البلاد بنحو 90 بالمائة عن ذروتها. انزلقت ريغا 7 بالمائة لتصل إلى 16.8 مليون طن في عام 2025. استقبلت فينتسبيلس، التي كانت ذات يوم منفذاً نفطياً رئيسياً، 8.53 مليون طن.
اتجهت ليتوانيا في الاتجاه المعاكس. عوضت كلايبيدا أحجام العبور بالحاويات والشحن من الرصيف إلى السفينة (ro-ro) والغاز الطبيعي المسال والأسمدة، وحصتها الإقليمية البالغة 44 بالمئة في النصف الأول من عام 2026 هي الأعلى التي حققتها. الفرق بين البلدين لم يكن محض صدفة: فقد استثمرت كلايبيدا في مناولة الحاويات وسعة العبارات قبل انهيار العبور، وتم بناء محطات لاتفيا خصيصًا لتدفق سلعة توقفت.
تقع إستونيا بينهما. نمات تالين بنسبة 5 في المائة لتصل إلى 13.8 مليون طن في عام 2025 بفضل حركة البضائع المنقولة بالدفع الرباعي والركاب، على الرغم من أن الربع الأول من عام 2026 شهد انخفاضًا بنسبة 7.9 في المائة ليصل إلى 3.07 مليون طن. تم تغطية خطوط السكك الحديدية عبر المنطقة في دليل شحن Rail Baltica الخاص بنا.
كيب بوميرانيا، رهان الـ 2.3 مليار يورو
بدأت بولندا بناء محطة حاويات عميقة المياه في سفينواويشيه في يوليو 2026، تحت اسم "كيب بوميرانيا". الميزانية هي 10 مليارات زلوتي، حوالي 2.3 مليار يورو. يهدف التصميم إلى قدرة استيعابية سنوية تبلغ 2 مليون حاوية نمطية (TEU)، و 2900 متر من الرصيف، وعمق اقتراب 17 مترًا، وممر ملاحي بعرض 70 كيلومترًا واسعًا بما يكفي للسفن التي يصل طولها إلى 400 متر، مع اكتمال العمل في نهاية عامي 2029 و 2030. الأعمال الأولى هي طريق وصول تقني من المتوقع أن يستغرق 10 أشهر.
لقد فشل المشروع بالفعل مرة واحدة. اتفاقية تمهيدية لعام 2023 مع اتحاد من شركتي DEME Concessions و QTerminals غطت عقد إيجار لمدة 30 عامًا، وتم التخلي عنها بعد أن تعذر على أحد الشركاء إتمام التمويل. هذا التاريخ هو السبب الذي يجعلني أتعامل مع تاريخ 2029/30 على أنه طموح وليس جدولاً زمنيًا. إذا تم افتتاحه في الوقت المحدد، فسيحصل بحر البلطيق على بوابة ثانية من فئة 2 مليون حاوية مكافئة (TEU) على بعد حوالي 350 كيلومترًا على طول الساحل البولندي نفسه من غدانسك، وهو ما يمثل قدرة استيعابية كبيرة لدولة واحدة.
كيف تقرأ أرقام موانئ البلطيق
- تحقق من السنة في كل سطر. التصنيفات البلطيقية تتداول بأرقام روسية لعام 2019 بجانب أرقام بولندية لعام 2025، مما يمجّد الموانئ الخاطئة.
- افصل الحمولة بالطن عن وحدات TEU قبل مقارنة أي شيء. أوست لوغا وغدانسك لا يتنافسان على نفس الشحنات.
- شاهد النصف الأول من عام 2026 بدلاً من إجمالي عام 2025. بدأ الاختلاف بين النمو في بولندا وليتوانيا والانخفاض في روسيا خلال هذا العام.
- عامل الأرقام التقريبية على أنها تقريبية. حمولة جوتنبرج وروستوك في هذا الجدول بين قوسين، وليست مُبلغ عنها.
- تذكر فئة الجليد والغاطس. تتضمن مكالمات بحر البلطيق الشمالي في الشتاء متطلبات لا يعرضها جدول الحمولة. تغطي ترتيب كسر الجمود لدينا الأساطيل خلفها.
- قارن بالمنطقة الأوسع. سيكون أكبر ميناء حاويات في دول البلطيق في منتصف الجدول في تصنيف الموانئ الأوروبية الخاص بنا.
أسئلة شائعة
ما هو أكبر ميناء على بحر البلطيق؟ حسب الحمولة، أوست-لوغا بحمولة 130.5 مليون طن في عام 2025. وحسب الحاويات، غدانسك بحوالي 2.8 مليون حاوية نمطية.
أي ميناء في البلطيق ينمو أسرع؟ كلايبيدا، بزيادة 22% في الحاويات في عام 2025، وهو الميناء الرئيسي الوحيد في البلطيق الذي حقق نمواً في إجمالي حجم الشحنات في النصف الأول من عام 2026.
ما هو حجم ميناء البلطيق؟ بلغت مناولة محطة غدانسك وحدها 2,766,475 حاوية مكافئة في عام 2025، وهو ما يزيد عن أي منشأة أخرى في منطقة البلطيق.
لماذا تنخفض أحجام الشحن في لاتفيا؟ توقف معظم حركة المرور العابرة التي كانت تمر عبر لاتفيا، حيث انخفض الشحن بالسكك الحديدية بنسبة 18.7 في المائة على أساس سنوي في النصف الأول من عام 2026 وانخفض عبور الموانئ بنحو 90 في المائة عن ذروته.
متى سيتم افتتاح المحطة البولندية الجديدة للمياه العميقة؟ بدأ البناء في يوليو 2026 مع استهداف الانتهاء في نهاية عامي 2029 و 2030، بسعة 2 مليون حاوية نمطية (TEU) في سوينويسي.
هل لا تزال الموانئ الروسية على بحر البلطيق تنمو؟ ليس في عام 2026. انخفضت تحميلات أوست-لوغا وبريمورسك بنسبة 10 في المائة و 9 في المائة على أساس سنوي في يونيو 2026، بعد أن انخفضت أوست-لوغا بالفعل بنسبة 3.4 في المائة في عام 2025.
*المصادر: الإصدارات السنوية للسلطة المينائية لعام 2025 من غدانسك، جدينيا، كلايبيدا، شتشيتسين وسفينوهاويشتشه، غوتنبرغ، تالين وفينتسبيلس، تقارير IAA PortNews عن حركة مرور الموانئ الروسية لعام 2025، تقارير الشحن بالسكك الحديدية اللاتفية للنصف الأول من عام 2026، بيانات التحميل من مركز أبحاث الطاقة والهواء النظيف لشهر يونيو 2026، بالإضافة إلى مواد حكومية بولندية ومواد صادرة عن سلطة الميناء حول بدء إنشاء رأس بوميرانيا في يوليو 2026. تعكس الأرقام المنشورات المتاحة في 1 سبتمبر 2026.*