


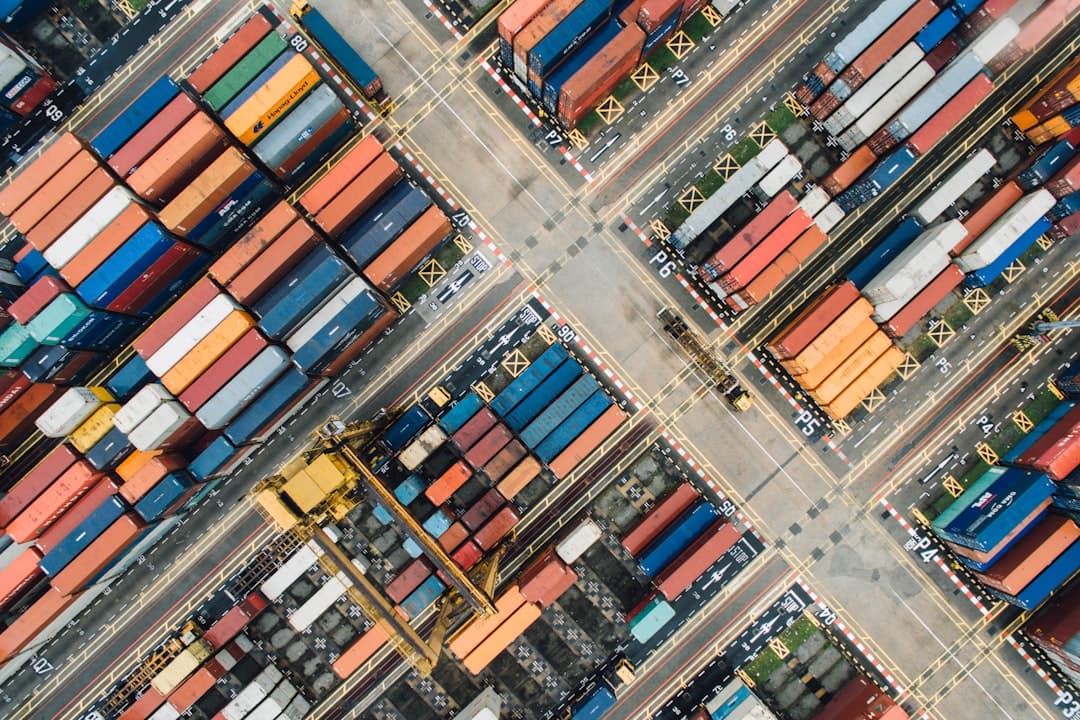
Rotterdam is the biggest port in Europe, handling 14.245 million TEU and 428.4 million tonnes of cargo in 2025. Antwerp-Bruges sits second at 13.63 million TEU. After those two the ranking drops by a full class, and the fastest growth in 2025 came from neither of them.
I have booked into most of these gateways at one point or another, and the ranking has never once decided where a box should land. What decides it is the hinterland: the rail path out of the terminal, the barge slot, the customs office that handles your procedure, and whether the terminal is a gateway or a transhipment hub that counts the same container twice. This is the list, with the caveats that make it usable.
The biggest ports in Europe in 2026, ranked by container throughput
Figures below are calendar year 2025 container throughput, the most recent complete year available in August 2026.
| # | Port | Country | 2025 TEU | Change | Role |
|---|---|---|---|---|---|
| 1 | Rotterdam | Netherlands | 14.245 million | Reclaimed first place | Gateway, plus 428.4 million tonnes of all cargo |
| 2 | Antwerp-Bruges | Belgium | 13.63 million | Up 0.7% | Gateway, chemicals and breakbulk heavy |
| 3 | Hamburg | Germany | 8.3 million | Up 7.3% | Gateway for central and eastern Europe |
| 4 | Valencia | Spain | 5.48 million | Up 14.2% | Mixed gateway and Mediterranean hub |
| 5 | Piraeus | Greece | 4.79 million | Down 7.8% | Transhipment hub with rail to the Balkans |
| 6 | Algeciras | Spain | 4.74 million | Up 2.1% | Pure transhipment on the Strait of Gibraltar |
| 7 | Bremerhaven | Germany | Growth above 10% | Rising | Gateway and car terminal, climbing the table |
| 8 | Gioia Tauro | Italy | Rising on MSC volumes | Rising | Mediterranean transhipment |
| 9 | Barcelona | Spain | Declined during 2025 | Falling | Gateway for Catalonia and southern France |
| 10 | Gdansk | Poland | Nearly 2.8 million | Up 23% | Baltic gateway, new Baltic Hub terminal |
Together the top ten European Union container ports moved 67 million TEU in 2025, up 3.1 percent on the year. Only two European ports sit inside the global top twenty, and they are the two at the head of this table, which is the part people usually get wrong. Europe does not have a Shanghai. It has two large gateways feeding a dense inland network, and that network is the actual asset.
Three rankings, three different winners
Ask which port is biggest and you get a different answer depending on the unit. When I benchmark two ports for a client, my first question is which of the three numbers below they are quoting at me.
By containers, Rotterdam leads Antwerp-Bruges by about 615,000 TEU, roughly 4.5 percent, having reclaimed the top spot in 2025. Even that lead comes with an asterisk the Rotterdam chief executive raised himself: part of the TEU growth was empty containers being shipped out, which count as boxes and carry no cargo. In the second quarter of 2026 Rotterdam led on TEU while trailing Antwerp-Bruges on container tonnage, which is as clean a demonstration as you will find that the unit decides the winner.
By tonnage, the picture changes again. That 428.4 million tonne total counts crude, refined products, iron ore, coal, agribulk and chemicals alongside boxes. A container ranking hides the reason Rotterdam exists. If you move liquid or dry bulk, the TEU table tells you nothing useful and you should be reading tonnage by commodity instead.
By what the number counts, transhipment hubs are not comparable to gateways at all. A box discharged at Algeciras and reloaded onto a feeder is counted twice, once in and once out, and never touches Spanish soil or Spanish customs. Piraeus and Gioia Tauro carry the same distortion. Hamburg's 8.3 million TEU represents far more inland cargo than Algeciras' 4.74 million, because most of Hamburg's boxes leave by rail or barge into Germany, Austria, Czechia and Poland. Rank by relevance to your own cargo, not by the headline.
Where the growth actually was in 2025
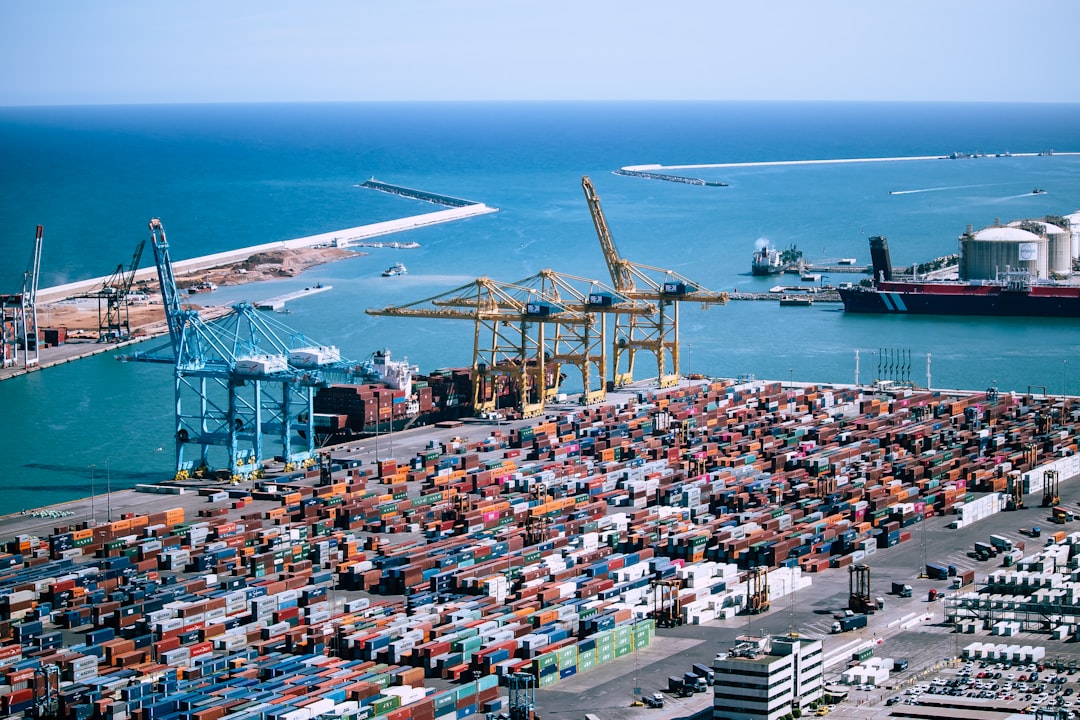
The interesting movement in the table is below the top two.
- Gdansk, up 23 percent to nearly 2.8 million TEU. Baltic Hub's newest terminal came online and Poland stopped being a feeder market. Deep-sea calls now discharge directly at Gdansk instead of transhipping through the North Sea range, which cuts several days off Baltic transit.
- Valencia, up 14.2 percent. Growth on both the gateway side and Mediterranean relay, helped by Red Sea routing pushing services around the Cape and reshuffling which Mediterranean call makes sense.
- Bremerhaven, above 10 percent. On course to move from seventh place in 2024 to fifth by the end of 2025, which is a rare jump for a mature north European terminal.
- Hamburg, up 7.3 percent. Driven by Asian trades: China up 6.5 percent, India up 49.2 percent, Malaysia up 84.3 percent. Hamburg outgrew both Rotterdam and Antwerp-Bruges in 2025 after several weak years.
- Genoa, up 7.9 percent, accelerating from 2.9 percent in 2024.
- Piraeus, down 7.8 percent, the largest decline in the top ten, and Barcelona also fell.
I read that list as a map of where carriers are moving capacity rather than as a scoreboard. Baltic and German volumes rising while Piraeus falls suggests services are shifting back toward direct northern calls, and the Red Sea situation keeps rewriting which Mediterranean hub sits on the efficient rotation.
Picking a European port: the checks that matter more than size
When a client asks which port to use, size never enters my answer. These do.
- Rail and barge frequency to your inland point. Rotterdam and Antwerp both offer daily barge to the German inland terminals; a Mediterranean call may save four sailing days and then lose six inland.
- Congestion behaviour under stress. North European terminals have run at high berth utilisation since 2024, and when labour or weather hits, waiting time appears at the quay rather than in the schedule. Ask for berth waiting figures from the terminal itself, not nominal capacity.
- Customs procedure fit. Whether the port supports your simplified procedure, your bonded warehouse, and the office of destination you already use. Changing entry point can mean changing guarantee arrangements.
- Empty container availability for your export leg. A port that is strong on imports and weak on exports leaves you repositioning boxes at your own cost.
- Terminal, not port. Almost nobody books a port. You book a terminal inside it, and productivity between terminals in the same port differs more than the difference between two ports.
What changes for European ports through 2026
Three shifts are worth watching this year, and we are already repricing lanes against the first of them. The European Union Emissions Trading System reaches full phase-in for maritime transport in 2026 after ramping from 2024, so the sailing distance to each port is now fully priced and calls that used to be interchangeable no longer are. A legislative update to the scheme is expected in the third quarter of 2026.
The second shift is landside and larger than it looks from a port office. The Entry/Exit System became fully operational on 10 April 2026, and its effect on road freight goes well beyond queue time: strict enforcement of the 90 days in 180 rule has cut many non-European Union drivers, Western Balkan hauliers in particular, out of the work they used to do inside the bloc. That triggered protests and border blockades in early 2026. For a port planner it means eastern land routings carry a driver availability risk they did not carry in 2024, and Baltic direct calls look better than the freight rate alone suggests.
Third, alliance reshuffling has moved service rotations more than in any year since 2017. The Gemini Cooperation between Maersk and Hapag-Lloyd started at the beginning of 2025 and inflated first quarter volumes at the ports it favoured, which then made the same quarter of 2026 read as a decline at those ports through pure base effect. Read any 2026 growth rate against what the alliance map looked like a year earlier before drawing a conclusion from it.
None of that changes the top of the table. The top two will stay first and second in 2026 by a wide margin over third place. Everything from third place down is genuinely in motion, and Gdansk at 23 percent growth is the entry most likely to have moved again by the time full-year 2026 figures publish.
Frequently asked questions
What is the biggest port in Europe?
Rotterdam, at 14.245 million TEU and 428.4 million tonnes of total cargo in 2025. It leads on containers and by a much wider margin on total tonnage, because it handles crude, products, ore and agribulk alongside boxes.
Is Antwerp bigger than Rotterdam?
Not on containers in 2025. Antwerp-Bruges moved 13.63 million TEU against Rotterdam's 14.245 million, a gap of about 4.5 percent. The two are close enough that the answer flips by measure and by quarter: in the second quarter of 2026 Rotterdam led on TEU while Antwerp-Bruges led on container tonnage, and Antwerp-Bruges is ahead in several breakbulk and chemical segments.
Which European port is growing fastest?
Gdansk, up 23 percent in 2025 to nearly 2.8 million TEU after Baltic Hub opened its newest terminal. Bremerhaven passed 10 percent growth and Valencia gained 14.2 percent, while Piraeus fell 7.8 percent.
Why do transhipment ports rank higher than their real cargo volume?
Because a transhipped container is counted twice, on discharge and on reload. Algeciras, Piraeus, Gioia Tauro and Marsaxlokk carry high relay shares, so their TEU figures overstate how much cargo actually enters the local economy compared with a gateway such as Hamburg.
Which European port should I use for cargo going to Poland or Czechia?
Compare Hamburg and Gdansk before defaulting to the largest port. The German port has the deepest rail network into central Europe, and Gdansk now takes direct deep-sea calls that avoid a feeder leg entirely. Choose Rotterdam when your inland move is barge-friendly along the Rhine.
Sources: container figures are calendar year 2025 as published by the port authorities themselves and by PortEconomics quarterly rankings. Rotterdam's container total is also quoted elsewhere as 14.2 and as 15.5 million TEU depending on what is counted; 14.245 million is the port authority figure. Bremerhaven, Gioia Tauro and Barcelona are given as growth rates because published full-year TEU totals for those ports were not consistent across sources at the time of writing. Transhipment shares are not disclosed uniformly, so gateway comparisons are indicative. Confirm current terminal productivity, berth waiting and rail departure frequency with your carrier before switching a port of entry.