


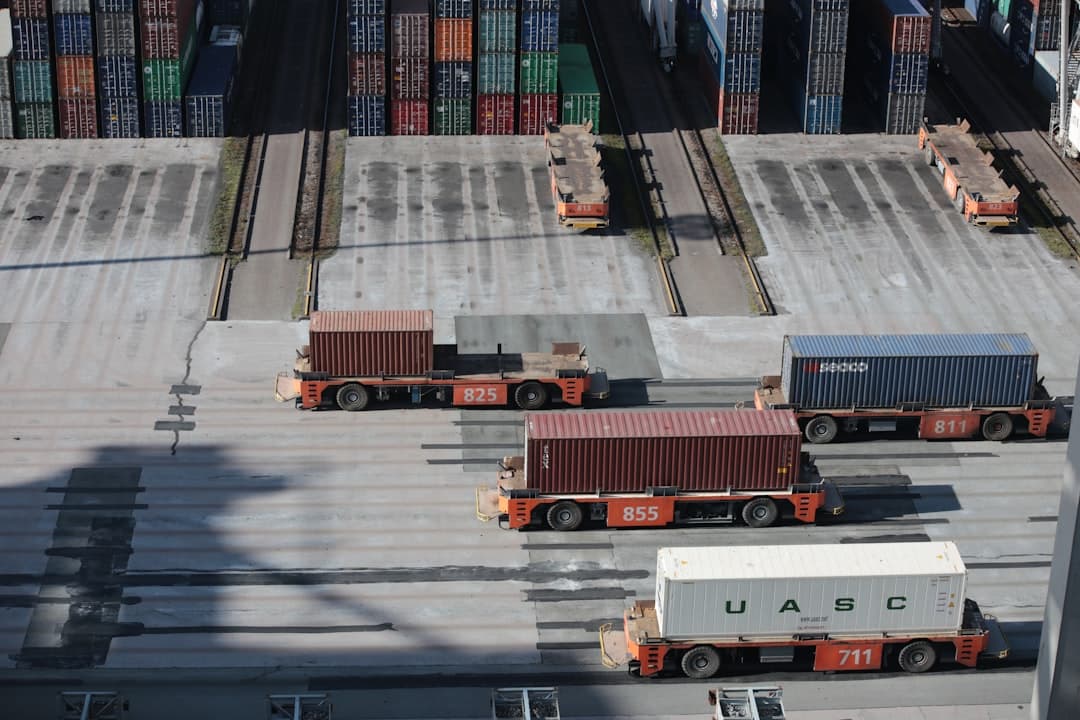

The Port of Los Angeles is the biggest container port in North America, finishing 2025 at 10.2 million TEU, its third-highest year on record. Long Beach set an outright record at 9,881,595 TEU. They sit in the same bay, share the same channel, and are ranked as rivals only because a city line runs between them.
That quirk shapes every list of American ports you will read, including this one. Counted as the single complex it operates as, San Pedro Bay handled 20.1 million TEU in 2025, which would place it inside the global top five and make it 41 percent larger than Rotterdam, the biggest port in Europe. I have watched dispatchers pick Long Beach over Los Angeles for reasons that had nothing to do with either ranking, and everything to do with which terminal had a chassis pool that week.
The biggest ports in North America in 2026, ranked
Container volumes are calendar year 2025 unless noted. Canadian and Mexican gateways are included because they compete for the same Asian cargo, which US-only lists tend to obscure.
| # | Port | Country | Container volume | Coast | What it is good at |
|---|---|---|---|---|---|
| 1 | Los Angeles | United States | 10.2 million TEU | Pacific | Transpacific imports, on-dock rail to Chicago |
| 2 | Long Beach | United States | 9,881,595 TEU, up 2.4% | Pacific | Record year, deep water, same complex as LA |
| 3 | New York and New Jersey | United States | 8,897,531 TEU | Atlantic | Largest East Coast gateway, 22 million consumers nearby |
| 4 | Savannah | United States | Nearly 5.7 million TEU | Atlantic | Single terminal scale, strong Southeast distribution |
| 5 | Houston | United States | 4,303,345 TEU, up 4% | Gulf | Record year, resins and petrochemicals |
| 6 | Manzanillo | Mexico | 3,893,357 TEU | Pacific | Mexico's largest box port, nearshoring inflows |
| 7 | Vancouver | Canada | 3.8 million TEU, 170.4 million tonnes | Pacific | Canada's largest, record year on both counts |
| 8 | Virginia | United States | Around 3.7 million TEU | Atlantic | Deep channel, no air draft restriction |
| 9 | Charleston | United States | Around 2.9 million TEU | Atlantic | Southeast manufacturing, 52 foot channel |
| 10 | Montreal | Canada | Around 1.7 million TEU | Atlantic, inland | Closest ocean call to Toronto and the Midwest |
The West Coast still accounts for close to half of all US container volume, and the two San Pedro Bay ports are most of that half. Everything else on the list competes for cargo that has decided not to come through California.
San Pedro Bay counted properly
Los Angeles at 10.2 million TEU plus Long Beach at 9,881,595 TEU puts the combined complex at 20.1 million TEU for 2025. For scale, Rotterdam moved 14.245 million TEU in the same year and Antwerp-Bruges 13.63 million. One American bay outmoves the largest port in Europe by 41 percent, though not the two of them together.
The split matters operationally even though it looks artificial on a map. The two ports run separate tariffs, separate terminal operators, separate leadership and separate labour arrangements within the same longshore agreement. Truck turn times can differ by half an hour between terminals a few kilometres apart. Long Beach management has publicly discussed a path toward 20 million TEU for that port alone over the coming decades, which tells you the constraint is landside rather than water.
What I take from the pairing is simpler. If your routing analysis compares Los Angeles against Savannah, you are comparing a 20.1 million TEU complex against a 5.7 million TEU port and treating the first as though it were half its size. Service frequency, sailing options and rail departures scale with the complex, not the city line.
The import skew nobody plans around
Long Beach published a clean breakdown for 2025: imports 4,779,559 TEU, up 1.1 percent, exports 1,141,113 TEU, down 5.5 percent. Loaded imports outnumber loaded exports by more than four to one. The balance is made up by empties going back to Asia. In my experience exporters underestimate what that ratio does to them until a booking rolls twice.
Three consequences follow, and exporters feel all of them.
- Equipment is available, slots are not. Empty boxes are plentiful at an import gateway. Vessel space for loaded exports on the headhaul leg is the scarce item, especially when carriers prioritise repositioning.
- Export rates move independently of import rates. A collapse in transpacific eastbound pricing tells you very little about what your westbound agricultural or resin load will pay.
- Detention and demurrage exposure is asymmetric. Import-heavy terminals build their free-time rules around inbound flow. Export bookings that miss an earliest return date can face a closed gate with cargo already on a chassis.
- Chassis availability follows the import cycle. During a front-loading surge, chassis go to import moves first, and export drayage waits.
The 2025 numbers were shaped by tariff timing more than by underlying demand. Volumes front-loaded ahead of announced duty changes and then softened, which is why Long Beach set a record in a year that felt weak to most people booking it.
East, Gulf and West: the routing question behind the ranking
Savannah at nearly 5.7 million TEU is the fourth largest US container port and the largest single container terminal on the East Coast, which is a different claim and the more useful one. New York and New Jersey is bigger overall at 8,897,531 TEU but spread across several terminals in two states. Watch the reporting period with Savannah in particular: its fiscal year figure runs higher than the calendar year one, so two correct numbers for the same port can differ by half a million TEU.
Houston at 4,303,345 TEU, a record and 4 percent up on the year, is the Gulf story. Resin exports out of the Texas petrochemical belt give it an export balance that West Coast ports do not have, so it is one of the few American gateways where an exporter is not fighting the flow.
Panama Canal capacity sits behind all of this. When canal transit slots tighten or draught restrictions apply, all-water services to the East Coast lose reliability and cargo shifts back to the West Coast plus rail. When the canal runs normally, East Coast direct calls win on landed cost for anything east of the Mississippi. That switch has flipped twice since 2023 and will flip again, which is why we keep both a West Coast and an East Coast rate on file for the same lane.
Canada and Mexico are in the same competition
Vancouver set records in 2025 at 3.8 million TEU and 170.4 million tonnes, which makes it Canada's largest port on both counts and a genuine alternative for Asian cargo bound for the Canadian prairies and the US Midwest. Prince Rupert offers the shortest sailing from Asia to a North American port and moves cargo straight onto Canadian National rail, though volumes there have been volatile.
Manzanillo, at 3,893,357 TEU, would rank inside the American top six if it were in the United States. Mexican Pacific gateways have absorbed a share of the nearshoring buildout, and cargo that lands there frequently crosses into the US by truck later, which means it never appears in a US port ranking at all. If you are benchmarking landed cost for goods manufactured in Mexico, the port table above is the wrong tool and a border crossing analysis is the right one.
Choosing a North American gateway
These are the questions I put to a terminal before my client commits volume to it.
- On-dock rail, not just rail service. A terminal with on-dock rail loads containers straight onto the train. Near-dock means a drayage move first, and that move is where days disappear.
- Chassis model. Pooled, terminal-supplied or carrier-supplied changes your cost and your exposure when volumes spike.
- Free time and the earliest return date rules at the specific terminal, in writing, before you book.
- Distance to your first inland node. A cheaper ocean leg into a port 800 kilometres from your distribution centre rarely survives contact with a trucking invoice.
- Alternate berth if the primary is disrupted. Ports that share a complex, such as Los Angeles and Long Beach, or Seattle and Tacoma, give you a fallback without changing your inland plan.
Frequently asked questions
What is the largest port in North America?
The Port of Los Angeles, which finished 2025 at 10.2 million TEU, its third-highest year on record. Long Beach followed with an outright record of 9,881,595 TEU. Counted as one complex, the two handled 20.1 million TEU, which is 41 percent more than Rotterdam.
What is the busiest port on the US East Coast?
New York and New Jersey, at 8,897,531 TEU in 2025. Savannah is second on the East Coast at nearly 5.7 million TEU but operates the largest single container terminal there.
Did US ports grow in 2025?
Unevenly, and several set records. Long Beach hit a calendar year record of 9,881,595 TEU, up 2.4 percent, with imports up 1.1 percent and exports down 5.5 percent. Houston set its own record at 4,303,345 TEU, up 4 percent. Much of the growth reflected cargo pulled forward ahead of tariff changes rather than steady demand.
Is it cheaper to import through the West Coast or the East Coast?
It depends on where the cargo is going and on Panama Canal conditions. West Coast plus rail usually wins for the Midwest and for anything time-sensitive. East Coast all-water services usually win for the Atlantic seaboard when the canal is operating without restrictions.
Should Mexican and Canadian ports be in a North American ranking?
For any real routing decision, yes. Manzanillo at 3,893,357 TEU and Vancouver at a record 3.8 million compete directly for Asian cargo destined for the United States, and goods landed in Mexico often finish the journey by truck across a land border.
Sources: Long Beach, Houston, New York and New Jersey, Vancouver and Manzanillo figures are calendar year 2025 as published by those ports; Los Angeles and Savannah come from port and trade press reporting, and Savannah's calendar year total differs from the fiscal year figure quoted elsewhere. Virginia, Charleston and Montreal are approximate. Rankings shift with the reporting calendar, and import-export splits are published inconsistently between ports. Confirm terminal-level free time, chassis arrangements and rail departure frequency before committing to a gateway.