


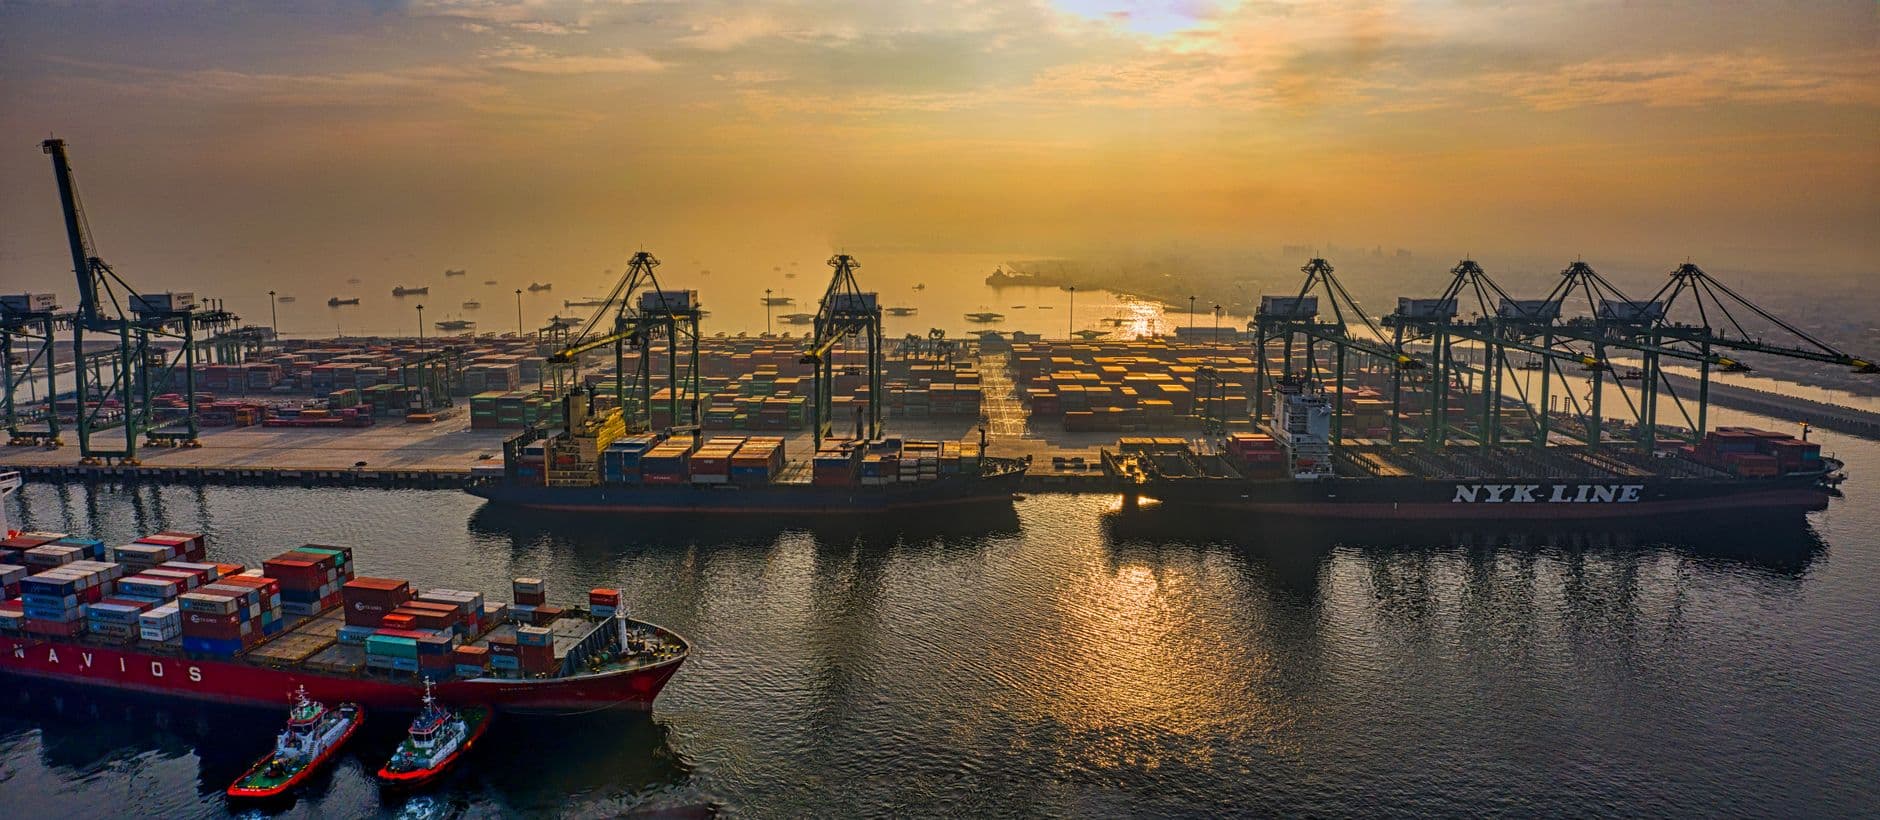
Asia handles the majority of the world's container throughput, and Shanghai alone moved 51.51 million TEU in 2024, the first port anywhere to pass 50 million. Singapore followed with 41.12 million TEU, Ningbo-Zhoushan with 39.3 million, and the next four places on the list are all Chinese. On volume, this is not a competition. It is a rout, and the global ranking by TEU makes the same point from the other direction, because most of its top ten sits in this region.
That is also why the ranking on its own tells you almost nothing useful. Two ports separated by a single place on the table can behave like completely different businesses, and I have watched shippers pick the bigger number and then wonder why their boxes sat. The question that matters for a routing decision is not how many TEU a port counts. It is how many of those TEU ever leave the terminal on a truck or a train.
The biggest ports in Asia in 2026, ranked
Figures below are full-year 2024 container throughput, the last complete year where every port in the table reports on a comparable basis. Ports report calendar-year volumes at different times, so mixing partial 2025 numbers into a ranking creates false movement. The top of the table is closer than an annual total suggests: on monthly estimates for May 2026, Singapore briefly passed Shanghai as the world's busiest container port without threatening the annual result.
| # | Port | Country | 2024 TEU | Primary role | What the number hides |
|---|---|---|---|---|---|
| 1 | Shanghai | China | 51.51 million | Gateway with transshipment | Yangshan deep-water terminals carry the biggest ships, upriver berths do not |
| 2 | Singapore | Singapore | 41.12 million | Transshipment | Around 90 percent of the boxes are transshipment, not Singapore trade |
| 3 | Ningbo-Zhoushan | China | 39.3 million | Gateway | Grew about 11 percent in 2024 and leads the world on cargo tonnage |
| 4 | Shenzhen | China | 33.4 million | Gateway | Yantian, Shekou and Chiwan are separate operations with separate queues |
| 5 | Qingdao | China | 30.9 million | Gateway | Strong rail connection inland, unusual for the region |
| 6 | Guangzhou | China | 26.1 million | Gateway | Heavily domestic and coastal feeder traffic |
| 7 | Busan | South Korea | 24.4 million | Transshipment and gateway | Roughly half the volume is transshipment |
| 8 | Tianjin | China | 23.3 million | Gateway | Serves Beijing and the northern industrial belt |
| 9 | Jebel Ali | United Arab Emirates | 15.5 million | Transshipment and gateway | Ninth in the world in 2024, and the Gulf ports are covered separately |
| 10 | Port Klang | Malaysia | 14.6 million | Transshipment | Competes directly with Singapore on relay cargo |
| 11 | Hong Kong | China | 13.7 million, then 12.99 million in 2025 | Transshipment | Was the world's busiest port in 2004 and is still falling |
| 12 | Tanjung Pelepas | Malaysia | 10.5 million | Transshipment | 92.7 percent transshipment, so alliance decisions move the whole number |
| 13 | Kaohsiung | Taiwan | Around 9 million | Gateway and transshipment | Volume sensitive to cross-strait routing decisions |
| 14 | Laem Chabang | Thailand | Around 9 million | Gateway | Road-dependent, one congested corridor to Bangkok |
| 15 | Colombo | Sri Lanka | Around 8 million | Transshipment | Handles a large share of Indian relay cargo |
| 16 | Mundra | India | Around 7 million | Gateway | India's largest container port, privately operated |
Gateway or transshipment decides everything
A gateway port serves a hinterland. Boxes arrive by sea and leave by road, rail or barge toward factories and shops, so the port's real capacity is set by its gates, its rail sidings and the motorway outside. Ningbo-Zhoushan, Tianjin and Mundra work this way.
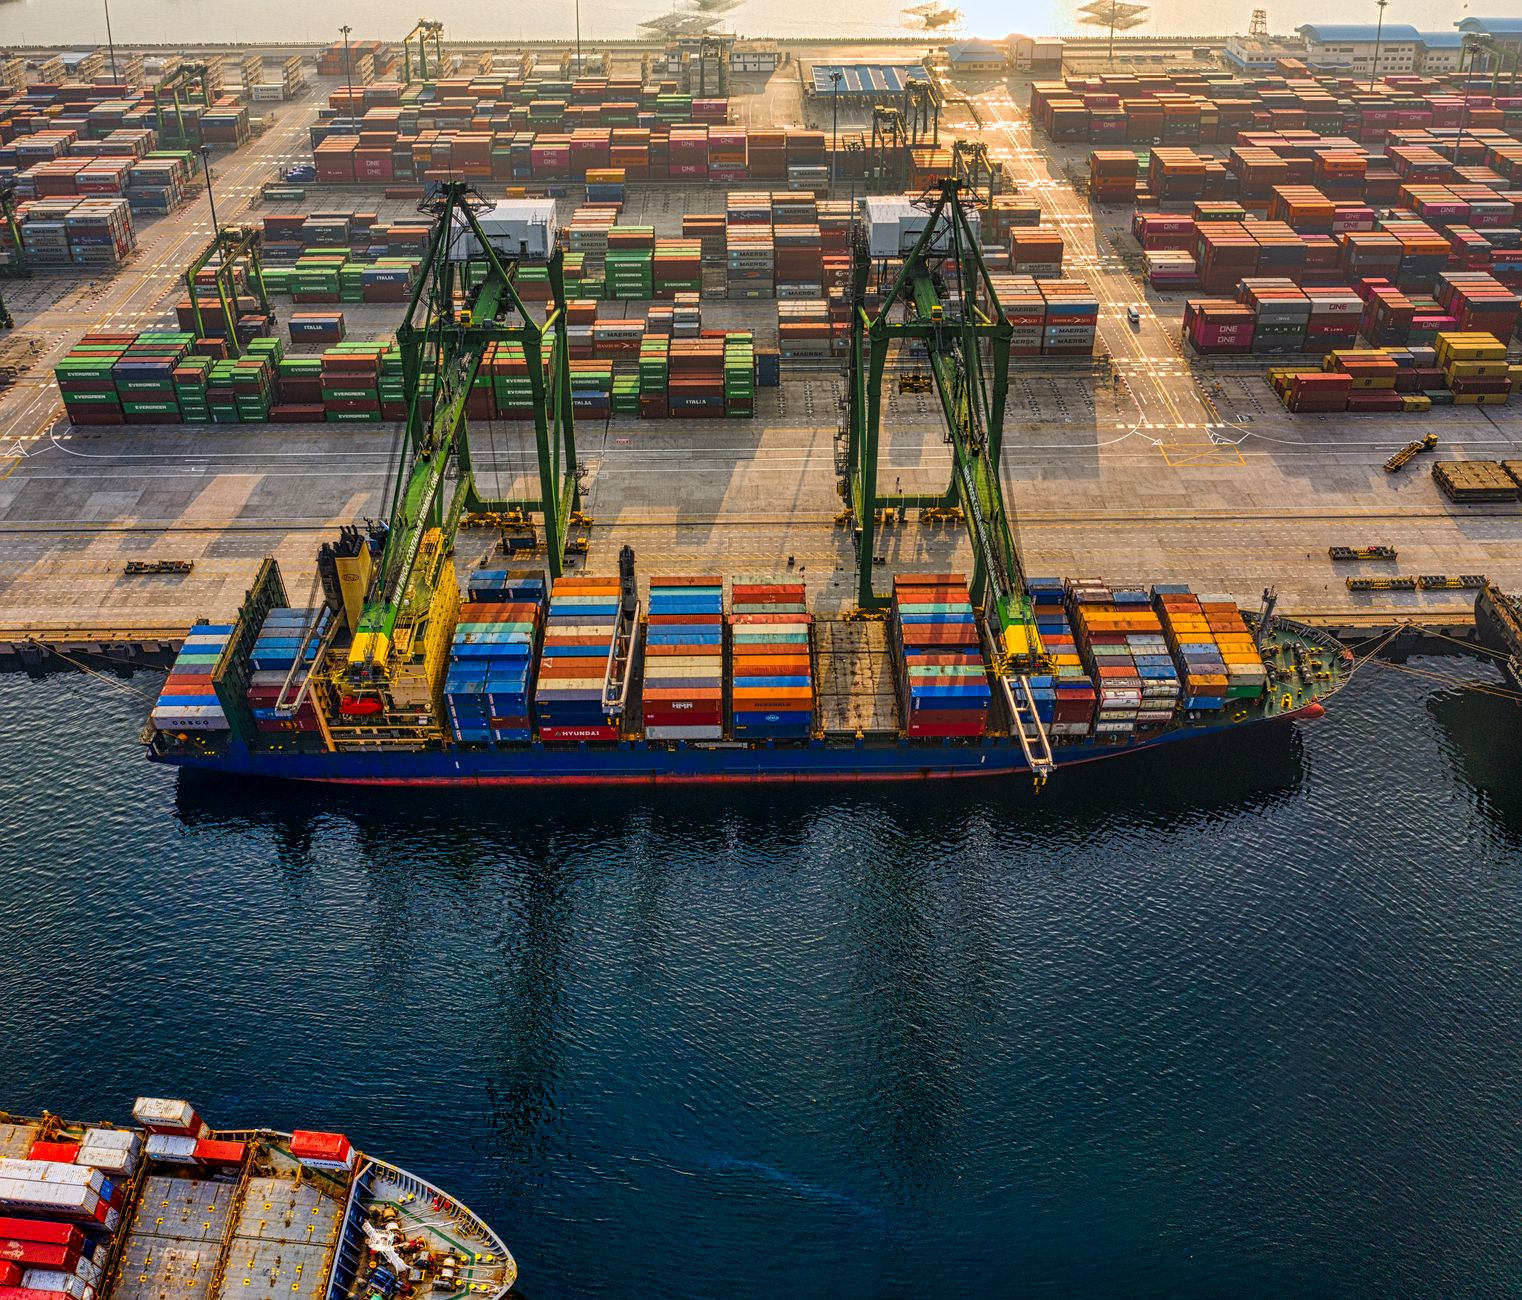
A transshipment hub serves other ships. Boxes arrive, wait on the stack, and leave on a different vessel, often to a smaller feeder port. Singapore, Colombo and Tanjung Pelepas are built for this, with quay cranes and yard density rather than gate throughput as the binding constraint.
The practical difference shows up in how each port fails. When a gateway port congests, containers pile up on the landside and your cargo is stuck in a yard you can at least drive to. When a hub congests, your box misses a connection and the delay is measured in whole sailing schedules, because the next ship to your destination may be a week out. I have seen a 2 day berthing delay at a hub turn into 11 days of transit time, and nothing in the TEU ranking predicts that. To be fair to the hubs, efficiency studies in regions such as the Mediterranean find that pure transshipment ports often score better than gateway or hybrid ports on throughput measures, so what I am describing is schedule risk rather than weak operation.
This is also why Singapore sitting second is slightly misleading in a list about Asian trade. A large share of what Singapore counts is cargo that was never destined for Singapore. Count only boxes that cross a national border on a truck and the picture rearranges completely, which is the same distinction that reorders the African ports ranking.
Hong Kong is the warning the ranking contains
Hong Kong was the busiest container port in the world in 2004. It recorded 13.7 million TEU in 2024, outside the top ten, and has been passed by Shenzhen, Guangzhou, Qingdao and Tianjin. No single event did that. Mainland Chinese ports built their own deep-water capacity, customs procedures improved at those ports, and the reason to relay cargo through Hong Kong quietly disappeared.
What that history says to anyone planning capacity: a transshipment hub's volume belongs to its customers, not to the port. It exists because carriers find it convenient, and carriers change networks. Hong Kong fell again in 2025, to 12.99 million TEU, as the Gemini Cooperation network took shape and left it as the first significant casualty of that reshuffle. Port Klang and Tanjung Pelepas both carry that exposure today. When an alliance reshuffles its Asia to Europe strings, hub volumes move in six-figure TEU steps.
Where the growth actually is
The Chinese coastal cluster is close to structurally full at the top. Growth continues, but the interesting percentage changes are elsewhere:
- India. Mundra passed Nhava Sheva to become the country's largest container port, and Indian volumes are growing off a small base relative to population. A great deal of Indian cargo still relays through Colombo or Singapore rather than sailing direct.
- Vietnam. The Cai Mep deep-water cluster near Ho Chi Minh City now takes vessels that previously had to call elsewhere, which is what made China-plus-one sourcing physically workable rather than just a slide in a strategy deck.
- Sri Lanka. Colombo recovered from the 2022 economic crisis and is expanding, precisely because Indian relay demand keeps rising.
- Malaysia. Both Malaysian hubs continue to take share from Singapore on price, while Singapore holds the reliability premium.
- Thailand and Indonesia. Laem Chabang and Tanjung Priok are gateway-constrained rather than quay-constrained, so their ceiling is a road and rail question, not a crane question.
How to read this table for a real routing decision
When someone asks me which Asian port to route through, the TEU column is the last thing I look at. The order I actually use:
- Direct call or relay? A direct call at a smaller gateway usually beats a relay through a giant hub, because every transshipment adds a chance to miss a connection.
- Landside, not seaside. Ask about gate hours, truck turn times and whether rail exists at all. Qingdao's inland rail links do more for a Central Asian shipment than Shanghai's raw volume.
- Terminal, not port. Shenzhen is three main terminal groups and Shanghai splits between Yangshan and upriver berths. Booking says the port name, performance comes from the terminal, and landside cost then arrives as drayage and port dwell.
- Alliance exposure. If your hub depends on one alliance's network, put a note in your risk register with a date to review it.
- Draft and vessel size. The largest container ships can only call where depth allows, which is why deep-water projects change trade patterns more than throughput records do.
The ranking above is genuinely useful for one thing: understanding where the world's manufacturing sits and how little slack the top of the table has. For the shipment in front of you, the smaller port with a working rail connection and a predictable gate will usually get your cargo home first.