


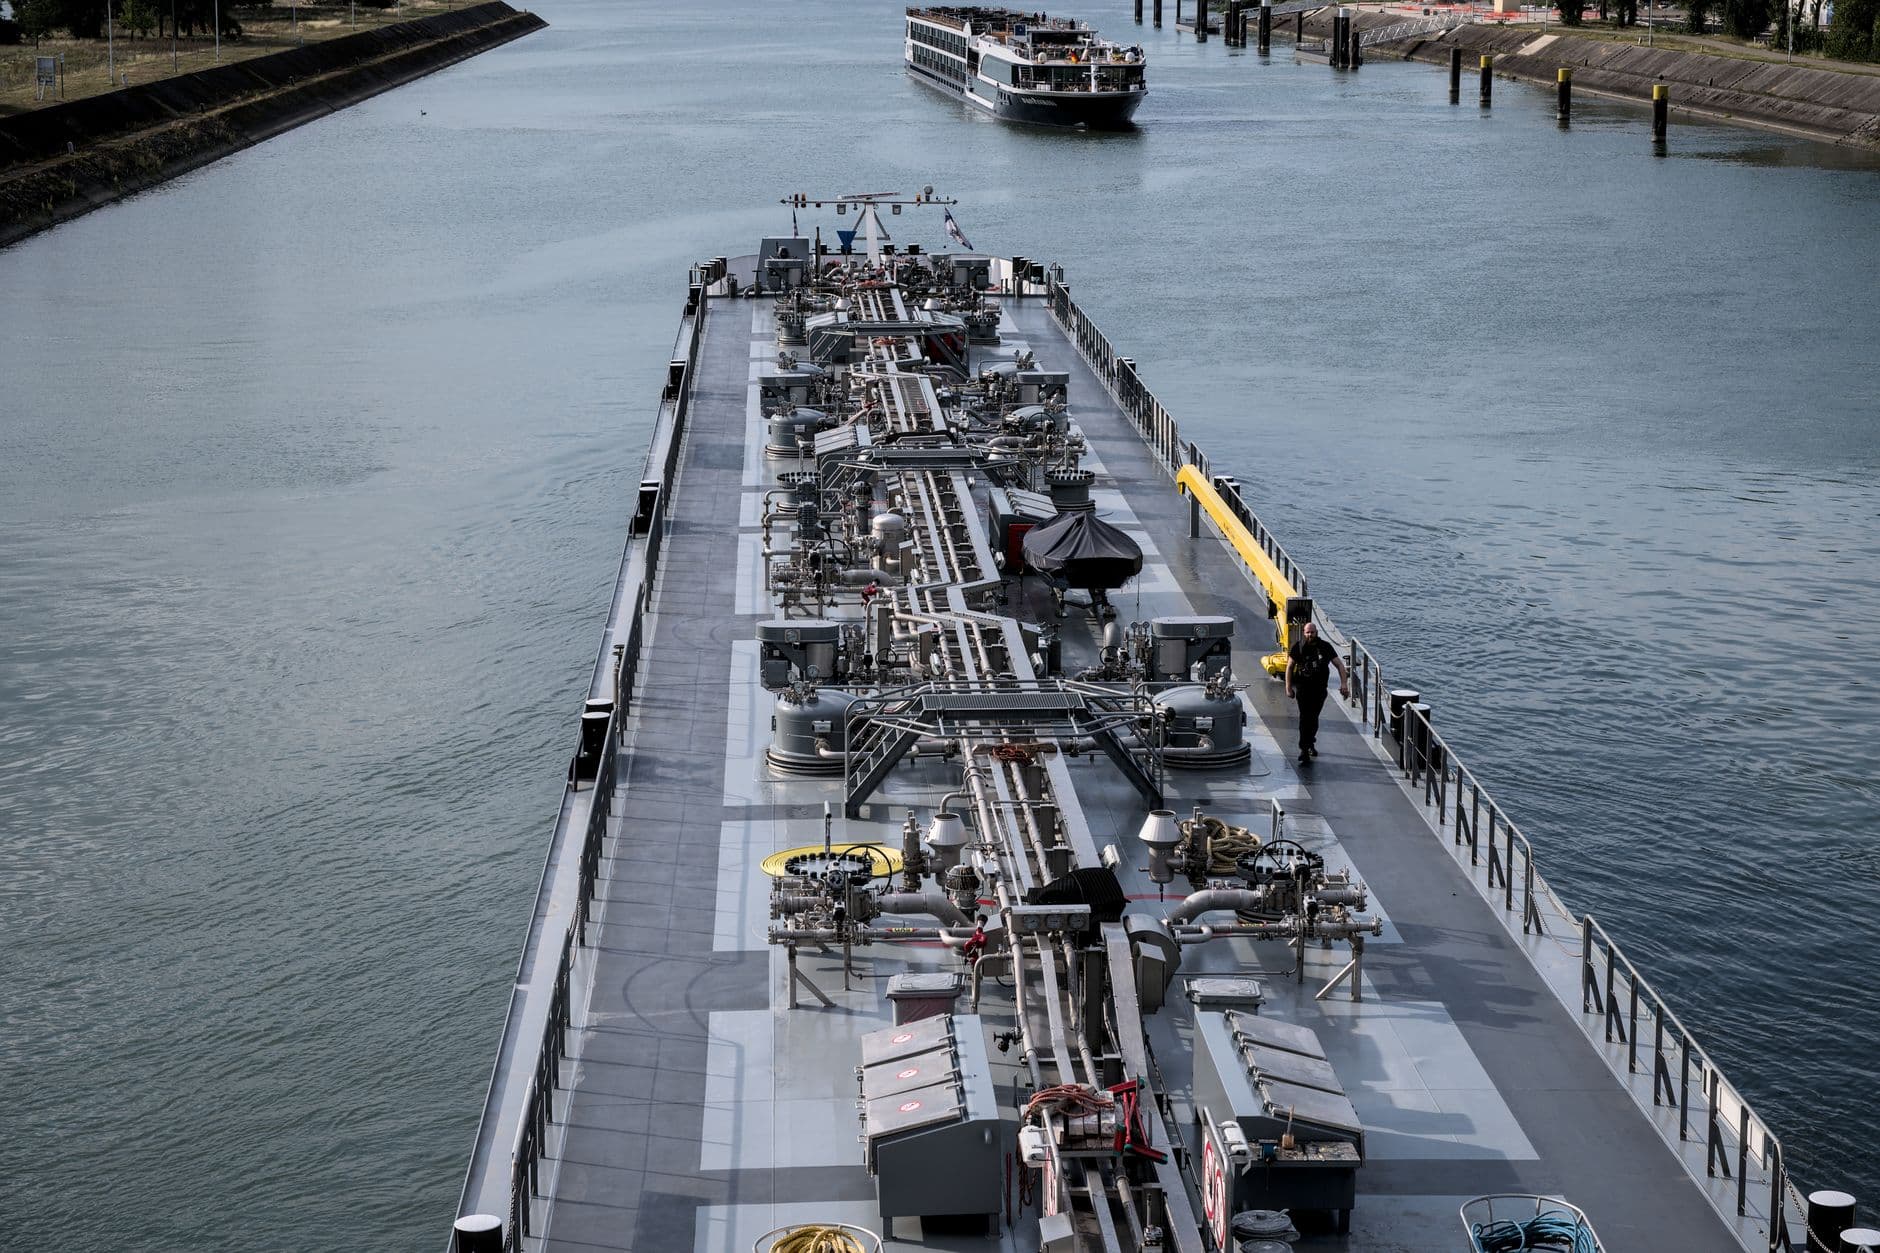

Singapore is the world's largest bunkering port by a margin no rival is close to closing, selling 56.775 million tonnes of marine fuel in 2025. Rotterdam follows at 9.823 million tonnes, and Zhoushan overtook Fujairah plus Antwerp-Bruges to claim third place at 8.03 million tonnes.
Bunker rankings look simple until you check the units. Singapore, Rotterdam plus Zhoushan report in tonnes; Fujairah reports in cubic metres, which is a volume rather than a mass. I have kept each port in its own reported unit below and flagged where the two cannot be compared, because converting one into the other without a density assumption is where most published tables quietly break.
The largest bunkering ports in 2026
| # | Port | Country | Volume | Period and unit |
|---|---|---|---|---|
| 1 | Singapore | Singapore | 56.775 million tonnes, up 3.4 percent | Calendar 2025, tonnes |
| 2 | Rotterdam | Netherlands | 9.823 million tonnes, up 0.03 percent | Calendar 2025, tonnes |
| 3 | Zhoushan | China | 8.03 million tonnes, up 10.6 percent from 7.26 million | Calendar 2025, tonnes |
| 4 | Antwerp-Bruges | Belgium | 7.855 million tonnes | Calendar 2025, tonnes |
| 5 | Fujairah | United Arab Emirates | 7.40 million cubic metres, down 2.8 percent from 7.61 million | Calendar 2025, cubic metres |
| 6 | Hong Kong | China | About 5.10 million tonnes | Calendar 2024, tonnes |
| 7 | Gibraltar | United Kingdom | About 4.54 million tonnes | Recent full year, tonnes |
| 8 | Panama | Panama | 394,655 tonnes in May 2026, down 13 percent on the year and an 8-month low; 477,900 tonnes in January 2025 for comparison | Monthly run rate, tonnes |
The concentration is extreme. Singapore alone sells more than the next five ports combined, and the top 10 hubs moved 111.93 million tonnes between them in 2024. For a vessel operator this means the bunker market has one price-setting location and a set of regional alternatives whose premiums move against it.
Singapore set a record, then cooled in 2026
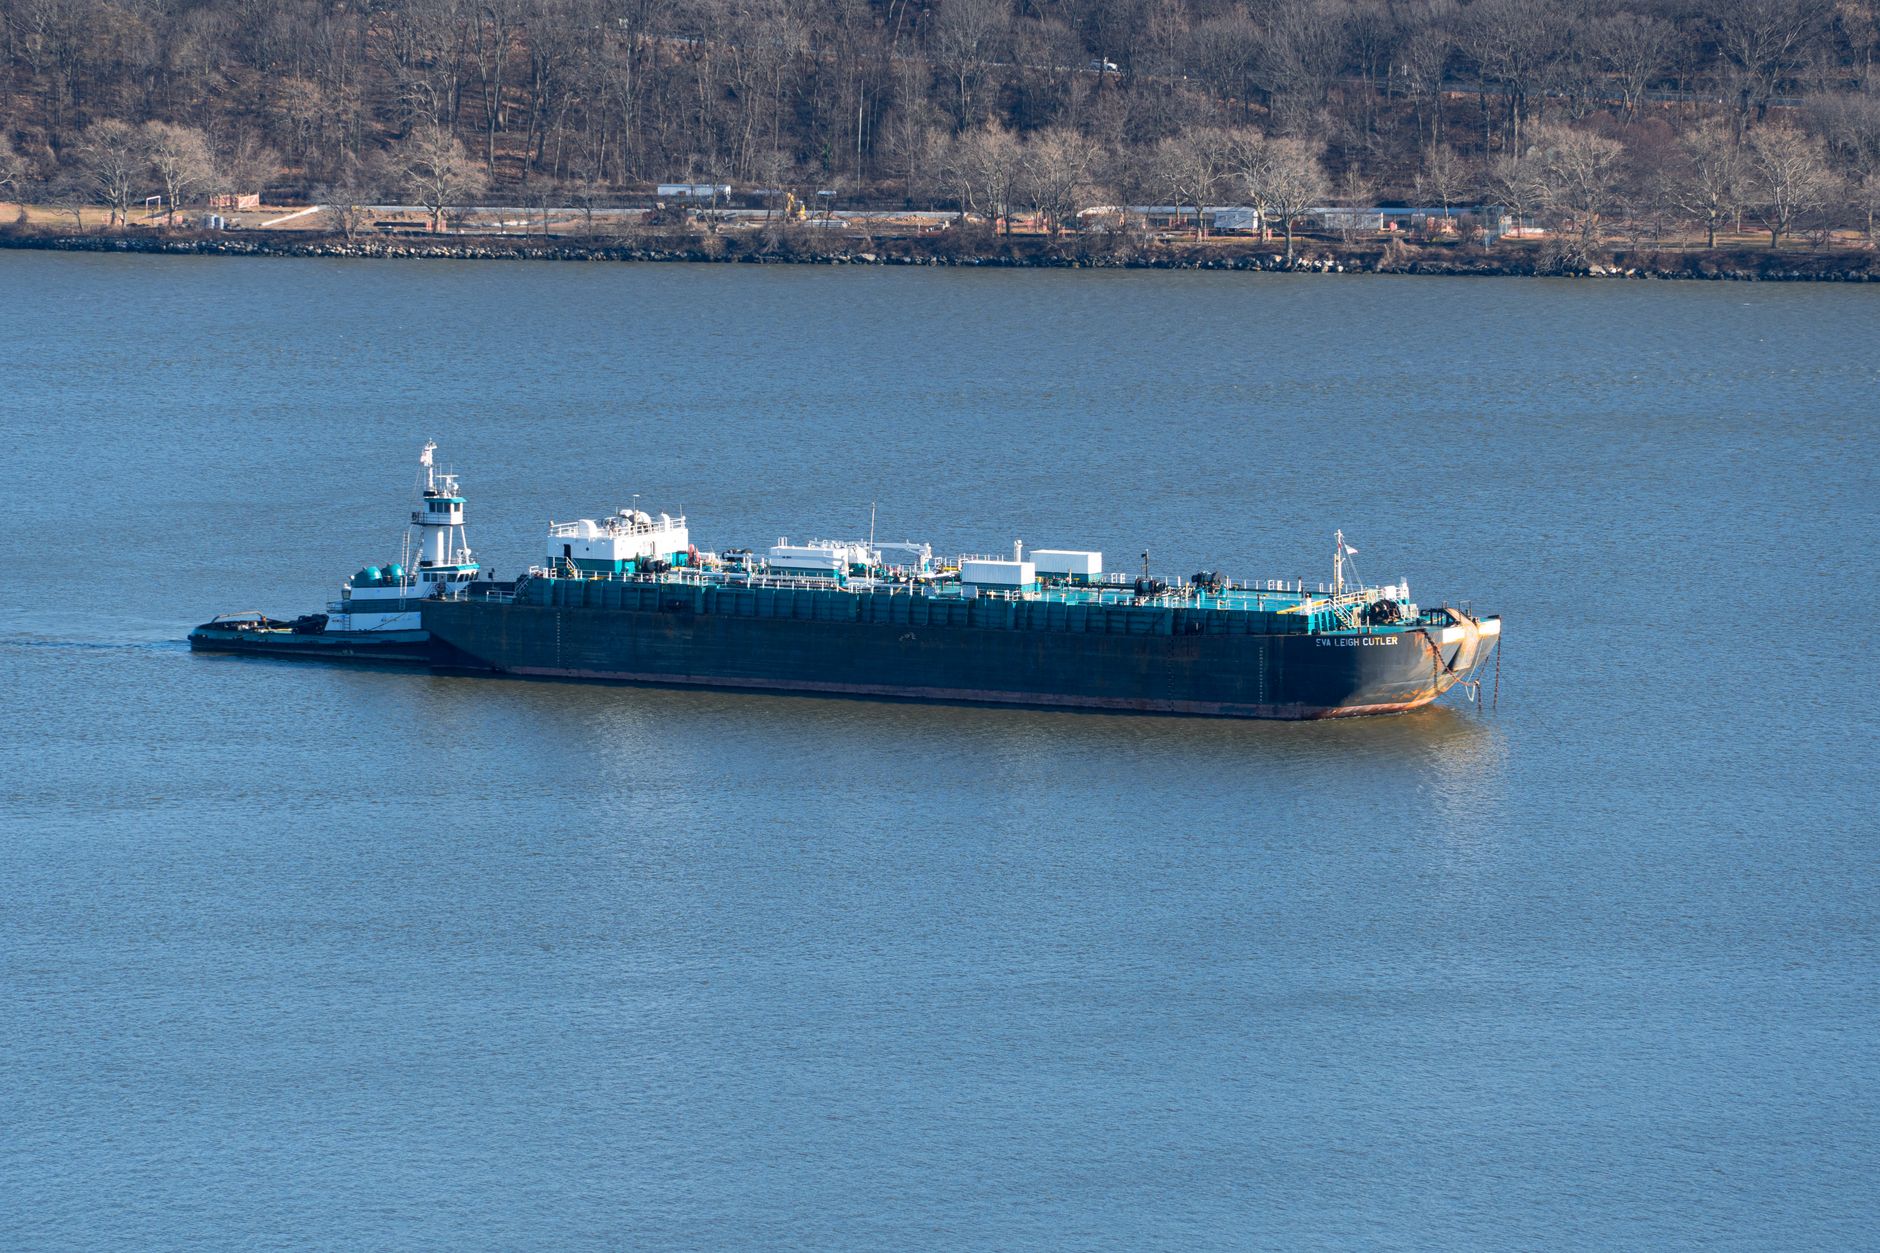
Rolling 12-month sales at Singapore crossed 57.5 million tonnes in January 2026, the first time annual volumes had passed that mark. January itself delivered 5.23 million tonnes, 16.5 percent above January 2025. March came in at 4.77 million tonnes against 4.47 million a year earlier. Sales across the first 4 months of 2026 reached 18.82 million tonnes, up 8.4 percent from 17.36 million in the same window of 2025.
Then the curve flattened. April 2026 dropped to a 14-month low, about 8 percent below March, and June recovered only to 4.67 million tonnes against 4.59 million in June 2025, a gain of 1.6 percent. My reading is that the early-2026 surge reflected rerouting demand rather than fleet growth, and rerouting demand fades as soon as voyage patterns settle.
Zhoushan took third place, and it took it from Fujairah
Zhoushan grew 10.6 percent in 2025 to 8.03 million tonnes, from 7.26 million in 2024. That pushed it past Antwerp-Bruges at 7.855 million tonnes and past Fujairah, making it the first Chinese hub in the global top 3. The port has also been extending its service envelope, completing its first bonded bunkering operation in the Majishan area and running LNG bunkering that pushed annual volume above 100,000 cubic metres for the first time.
Growth of that speed comes with operational caveats. Zhoushan bunkering was suspended and later fully restored after typhoon disruption, which is a reminder that Chinese east-coast hubs carry a weather risk profile Singapore does not share to the same degree.
Fujairah fell more than 70 percent in April 2026
Fujairah closed 2025 at 7.40 million cubic metres, down 2.8 percent from 7.61 million, with the decline concentrated in low-sulphur grades: 380 CST VLSFO fell 7.3 percent to 4.72 million cubic metres while 380 CST HSFO rose 4 percent to 2.22 million. January 2026 briefly hit a 4-month high. Then marine fuel sales fell more than 70 percent to record lows in April 2026 as regional conflict disrupted both supply and vessel demand, and first-half volumes finished more than 50 percent below 2025.
The recovery started in July. Sales rose to 640,715 cubic metres, the highest since April 2025 and 3.1 percent above July 2025, which tells me the April collapse was a supply and transit shock rather than a permanent loss of the hub. The context is the Strait of Hormuz, which was officially closed to commercial traffic 4 times in the 2 months to mid-August 2026. A bunker hub sitting just outside a strait that keeps shutting cannot hold a stable monthly volume, however good its tank farm is.
That is the single most consequential change in this ranking. A hub that normally supplies the Gulf approaches became unreliable in the same period Qatari gas exports were hit, and vessels calling in the region had to plan fuel around a moving target. Anyone routing through the Gulf should read this alongside our Strait of Hormuz bypass guide.
Rotterdam is losing barrels and winning biofuel
Rotterdam finished 2025 essentially flat at 9.823 million tonnes, a rise of 0.03 percent, then fell hard. First-half 2026 bunker sales came in 25.1 percent below the same period of 2025, and the decline hit every conventional grade, with VLSFO down about 46 percent. Losing nearly half your flagship grade in 6 months is not a rerouting effect, it is a change in which ships call.
The port did reclaim one title decisively. Second-quarter 2026 bio-blend sales reached 239,875 tonnes, up 45.2 percent year on year and the strongest quarter since the first quarter of 2024, which put Rotterdam back ahead of Singapore in reported bio-bunker volume after losing that crown to the Asian hub. A hub shrinking on fuel oil while growing 45 percent on biofuel is repositioning rather than declining, and for owners with FuelEU exposure that mix matters more than the headline total.
Alternative fuels are still small in absolute terms but no longer marginal. The 8 months before 2026 opened added 1.2 million tonnes of oil equivalent in LNG bunker demand plus 0.4 million in methanol. For operators inside the EU emissions regime, fuel choice at a European berth now carries a compliance cost as well as a per-tonne price, which we unpack in the EU ETS shipping surcharge audit.
The second tier is where the competition is
Below the top 5 the ordering shifts year to year, and the ports involved are Busan, Hong Kong, Panama, Gibraltar, Shanghai plus Algeciras. Hong Kong supplied about 5.10 million tonnes in 2024 and Gibraltar around 4.54 million in its most recent full year, which puts both within reach of Fujairah's reduced 2026 run rate. Panama went the other way: May 2026 sales of 394,655 tonnes were an 8-month low, 13 percent under May 2025.
Two second-tier movements in 2026 are worth naming. Antwerp-Bruges lifted second-quarter sales 3 percent year on year to 2.05 million tonnes, and its best-selling grade was HSFO at 659,182 tonnes, which is direct evidence that scrubber-fitted tonnage keeps choosing the port. Gibraltar recorded a 17.2 percent year-on-year rise in bunker-only calls in June 2026, attributed to route restructuring caused by the Gulf conflict.
I watch this tier for a specific reason: it tells you where a diverted vessel can actually refuel. When Fujairah lost more than 70 percent of its volume in April 2026, the ships that would have bunkered there needed an alternative inside the same voyage plan, and Gibraltar plus Algeciras absorb westbound tonnage while Singapore takes the eastbound flow. A hub ranking read as a static league table misses that substitution entirely.
Alternative fuels are reshuffling the same tier. Zhoushan pushed annual LNG bunker volume past 100,000 cubic metres for the first time, Singapore delivered 58,690 tonnes of LNG bunkers in July 2026 alone, a rise of 41.3 percent year on year, and Rotterdam took back the biofuel lead in the second quarter. Those volumes are small against 56.775 million tonnes of conventional fuel, yet they decide which berth a dual-fuel newbuilding can use, and our clients ordering methanol-capable tonnage now ask about bunker availability before they ask about price.
Fuel quality is the axis buyers weigh next to price. ISO 8217 specifications govern what a supplier may deliver, and disputes typically surface after a drip sample fails on catalytic fines, flash point or sediment. Blend variability widened as biofuel share climbed, so my advice is to hold sampling discipline tight at unfamiliar berths instead of assuming a premium hub guarantees a premium barrel.
How to read a bunker ranking without being misled
- Check the unit. Fujairah's 7.40 million cubic metres is roughly 7 million tonnes at a VLSFO density near 0.95, which changes its position against Antwerp-Bruges at 7.855 million tonnes.
- Check the year. Hong Kong's 5.10 million tonnes is a 2024 figure, so it sits in this table on a different basis from the 2025 leaders.
- Separate sales from capacity. These are volumes actually delivered, not what a hub could supply if demand appeared.
- Watch grade mix, not just totals. Fujairah's headline fell 2.8 percent while its HSFO volume rose 4 percent, which tells you scrubber-fitted tonnage kept calling.
- Treat single months carefully. Panama ran 477,900 tonnes in January 2025 and 394,655 in May 2026, so either month on its own would misrepresent the port.
Bunker geography follows container and dry bulk geography closely, which is why the ranking overlaps with the busiest container ports and with the biggest ports in Europe. A hub becomes a fuel hub because ships are already passing it.
Common questions
Which port sells the most marine fuel in the world? Singapore, at 56.775 million tonnes in 2025, a rise of 3.4 percent. Its rolling 12-month total passed 57.5 million tonnes in January 2026, and it sells more than the next 5 hubs combined.
Is Zhoushan now bigger than Fujairah? Yes, on the 2025 numbers. Zhoushan reached 8.03 million tonnes while Fujairah reported 7.40 million cubic metres, and the Chinese port grew 10.6 percent while the UAE hub fell 2.8 percent.
Why did Fujairah volumes collapse in 2026, and has it recovered? Regional conflict cut both supply and calling traffic, pushing April 2026 sales more than 70 percent lower to record lows, with first-half volumes more than 50 percent below 2025. July brought 640,715 cubic metres, the highest since April 2025 and 3.1 percent above July 2025, so the hub is recovering while the Strait of Hormuz stays unpredictable.
Is Rotterdam still the second-largest bunker port? Yes on 2025 volume at 9.823 million tonnes, but its first-half 2026 sales fell 25.1 percent with VLSFO down about 46 percent. Its bio-blend volume moved the other way, reaching 239,875 tonnes in the second quarter of 2026, up 45.2 percent.
Why does one source rank Fujairah third and another fourth? Because ranking in cubic metres against tonnes changes the order, and because some tables use 2024 data while others use 2025. Every figure above carries its period plus unit for that reason.
Sources: Maritime and Port Authority of Singapore monthly sales data, Port of Rotterdam plus Port of Antwerp-Bruges throughput reporting, Zhoushan port bunkering statements, Fujairah Oil Industry Zone volume reporting via S&P Global Commodity Insights. Volumes are as reported by each port in its own unit.