


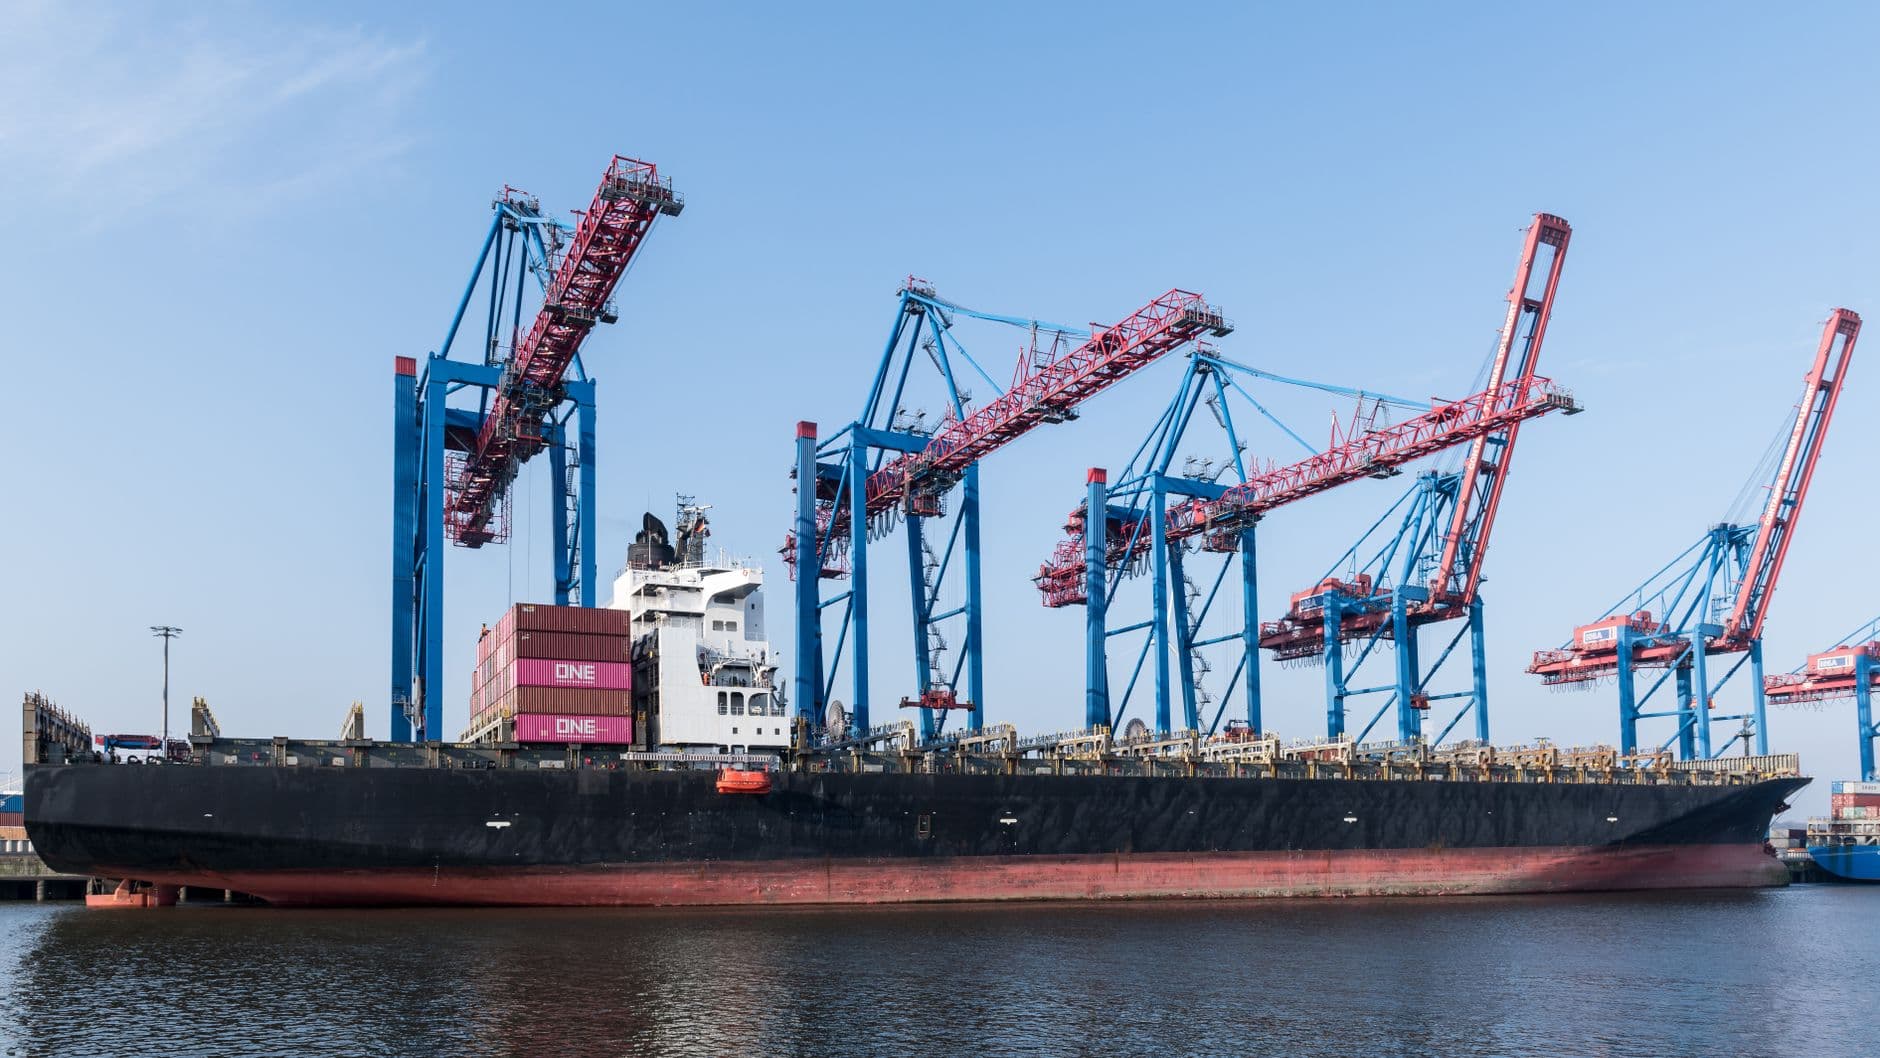

Fuzhou, not Shanghai or Singapore, is the world's most efficient container port. That is the headline finding of the Container Port Performance Index (CPPI) 2025, published jointly by the World Bank and S&P Global Market Intelligence on 10 June 2026. The index ranks 400 ports on how long vessels sit in port, not how many boxes they move, and the two rankings barely overlap. As of 30 September 2026, the CPPI 2025 report and its methodology note (also dated 10 June 2026) remain the most recent edition; we found no update issued after the June release through the end of September.
What the CPPI actually measures
The CPPI scores vessel time in port: the hours between a ship's AIS-detected arrival at anchorage or pilot station and the moment it leaves berth. Time in the port area after leaving berth (bunkering, waiting in a safe area) is excluded because the World Bank and S&P Global judge it outside a port's control. Each call is split into arrival hours (waiting plus steam-in) and berth hours (cargo operations plus idle time), grouped into five ship-size bands, from feeders under 1,500 TEU to ultra-large carriers above 13,500 TEU, and ten call-size bands within each, so a small feeder port is never benchmarked against a mega-hub handling neo-panamax strings.
Two methods run on the same cleaned dataset. The administrative approach compares each port's average hours in a call-size group against the global average, weights by call volume, and aggregates across ship sizes using a fuel-consumption index: an extra hour in port is roughly 2.57 times costlier in fuel for an ultra-large carrier than for a mid-size feeder. The statistical approach applies non-negative matrix factorization to infer latent performance patterns across all ports at once, rather than comparing each port to a benchmark. The final score is the arithmetic average of the two, standardized since the 2024 edition against a fixed reference year (2024 set at a global average of zero), so score changes over time reflect real performance shift rather than sample composition.
Underlying data comes from ten major carriers representing about 75 to 80 percent of global fleet capacity, submitted to S&P Global's Port Performance Program and cross-checked against AIS tracks at a reported 95 percent match rate. Ports with fewer than 24 recorded calls a year are dropped.
What the CPPI does not measure
- Cargo dwell time in the yard or on the quay after discharge, which drives many shippers' real experience of a port
- Landside congestion: gate queues, chassis shortages, rail ramp backlogs, and road access once containers leave the terminal
- Freight cost, terminal handling charges, or total logistics cost
- Performance of individual terminals within a multi-terminal port; the CPPI reports port-level aggregates only, so a strong port score can mask a weak terminal and vice versa
The report describes the CPPI as "an initial diagnostic and benchmarking instrument rather than a comprehensive performance scorecard" that should be "interpreted alongside local knowledge and complementary indicators." The landside half of the story, delay after the vessel sails, is covered in our piece on drayage costs and the chassis problem.
The top 20 ports in CPPI 2025
The ranking below reproduces Table 1 of the World Bank and S&P Global report ("Top 20 CPPI in 2025") and matches the Rank 2025 and CPPI 2025 columns of the report's annex spreadsheet, which ranks 400 ports. Operators are listed only where a company source names them.
| Rank | Port | Country/territory | Region | CPPI score, 2025 | Operator (where stated) |
|---|---|---|---|---|---|
| 1 | Fuzhou | China | East Asia and Pacific | 145 | Not stated |
| 2 | Dalian | China | East Asia and Pacific | 141 | Not stated |
| 3 | Salalah | Oman | MENAAP | 136 | APM Terminals |
| 4 | Mawan | China | East Asia and Pacific | 135 | Not stated |
| 5 | Chiwan | China | East Asia and Pacific | 134 | Not stated |
| 6 | Tanger Med | Morocco | MENAAP | 134 | APM Terminals (terminal operator at MedPort) |
| 7 | Ningbo | China | East Asia and Pacific | 130 | Not stated |
| 8 | Hamad Port | Qatar | MENAAP | 129 | Not stated |
| 9 | Hong Kong | Hong Kong SAR, China | East Asia and Pacific | 123 | Not stated |
| 10 | Kobe | Japan | East Asia and Pacific | 123 | Not stated |
| 11 | Cai Mep | Vietnam | East Asia and Pacific | 122 | APM Terminals (Cai Mep International Terminal) |
| 12 | Algeciras | Spain | Europe and Central Asia | 122 | APM Terminals |
| 13 | Haiphong | Vietnam | East Asia and Pacific | 122 | APM Terminals |
| 14 | Xiamen | China | East Asia and Pacific | 121 | APM Terminals (partial, one terminal) |
| 15 | Port Said | Egypt | MENAAP | 117 | APM Terminals (Suez Canal Container Terminal) |
| 16 | Tianjin | China | East Asia and Pacific | 115 | Not stated |
| 17 | Kaohsiung | Taiwan, China | East Asia and Pacific | 114 | Not stated |
| 18 | Tanjung Pelepas | Malaysia | East Asia and Pacific | 111 | APM Terminals |
| 19 | Khalifa Bin Salman Port | Bahrain | MENAAP | 106 | APM Terminals |
| 20 | Posorja | Ecuador | Latin America and the Caribbean | 104 | DP World |
APM Terminals operates the terminal at nine of these 20 ports, more than any other operator, per the company's 10 June 2026 commentary. Posorja is the sole Latin American entrant for a second straight year and the only regional port with two consecutive top-20 finishes, DP World said on 23 July 2026. MENAAP in the table is the World Bank region that groups the Middle East, North Africa, Pakistan and Afghanistan. Scores are standardized index values, not percentages or minutes. The 2024 global average is set to zero, so a positive score means faster than that benchmark and a negative score slower. Of the 400 ranked ports, 196 scored below zero in 2025.
Who improved the most
Two improvement tables appear in the report. Over 2020 to 2025, the biggest gainers were Port Elizabeth (South Africa, up 80 points), Khalifa Bin Salman Port (Bahrain, up 75), Posorja (Ecuador, up 70, third most improved globally per DP World), Göteborg (Sweden, up 68) and Muhammad Bin Qasim (Pakistan, up 52). Year on year, 2024 to 2025, the standout movers were Durban (up 479 from -721), Freeport (up 221), Coega/Ngqura (up 165), Cristobal (up 154) and Manzanillo (up 152), all in Africa and Latin America. Several ports deep in negative territory still posted the largest single-year gains: "most improved" and "most efficient" are different questions. Durban's 2025 score of -242 still trails the global average even after its jump.
Regional patterns
East Asian ports, mostly Chinese, dominate the table, joined by Middle Eastern gateways such as Salalah and Hamad Port, reflecting export-oriented trade: cargo pre-positioned in yards in load sequence shortens berth time in a way import-heavy ports cannot easily replicate. Upper-middle-income economies slightly outperformed high-income ones on average in 2025, a pattern recurring across editions. Europe and North America kept recovering toward pre-pandemic performance but remain exposed to congestion and hinterland bottlenecks. Sub-Saharan Africa recorded the lowest average scores, tied to import-dominated trade and limited inter-port competition. The Middle East overall declined in 2025 despite Salalah and Hamad Port's top-10 places, tied to Red Sea disruption and later rerouting around the Strait of Hormuz.

Big ports that rank low, or barely register
This is where CPPI diverges most sharply from the throughput tables in our busiest container ports ranking. The table sets the volume rank from that article against the CPPI 2025 rank and score from the World Bank annex. Shenzhen has no single line in the index: CPPI lists Mawan, Chiwan and Yantian separately, and the report notes that Yangshan is counted inside Shanghai.
| Port | Rank by volume | CPPI 2025 rank | CPPI score, 2025 |
|---|---|---|---|
| Shanghai | 1 | 23 | 98 |
| Singapore | 2 | 21 | 100 |
| Ningbo | 3 | 7 | 130 |
| Shenzhen (Mawan / Chiwan / Yantian) | 4 | 4 / 5 / 35 | 135 / 134 / 82 |
| Qingdao | 5 | 101 | 24 |
| Guangzhou | 6 | 36 | 82 |
| Busan | 7 | 24 | 97 |
| Tianjin | 8 | 16 | 115 |
| Jebel Ali | 9 | 45 | 68 |
| Port Klang | 10 | 46 | 68 |
| Rotterdam | 11 | 333 | -38 |
| Hong Kong | 12 | 9 | 123 |
| Antwerp | 13 | 306 | -21 |
| Los Angeles | 16 | 88 | 29 |
Two patterns stand out. Most of Asia's giants land between 4th and 46th place, with Qingdao at 101st the exception, and Singapore, Shanghai and Busan sit just outside the top 20 at 21st, 23rd and 24th. Europe's two largest gateways sit far down: Rotterdam 333rd, Antwerp 306th, both below the 2024 benchmark.
US ports trail as well. The annex shows Philadelphia as the only US port in the global top 50 (48th), with Los Angeles at 88th, New York and New Jersey at 117th, Houston at 334th and Tacoma at 384th, the lowest of the 22 US ports ranked. None of this means Shanghai, Singapore or the big US gateways run badly for shippers: they offer service breadth, digital tooling (see our automated terminals rundown) and connectivity a vessel-turnaround score cannot capture. A shipper should not read a low CPPI rank as a service-quality failure, or a high rank as a cost or reliability guarantee.
Using CPPI in carrier, routing and port-choice decisions
- Treat CPPI as a vessel-side signal, not a full service scorecard; pair it with dwell-time and gate-turn data before setting service-level expectations.
- Compare ports within the same ship-size band and trade lane. A feeder port's score is not comparable to a neo-panamax hub's score on the same list.
- Check the improvement tables, not just the top 20; a port moving fast from a low base can matter more for a five-year sourcing decision than this year's rank.
- Cross-reference operator identity. Where the same terminal operator runs your port of call and a nearby CPPI top performer, that consistency, covered in our operator ranking, can be a more actionable signal than the raw score.
- Watch regional averages, not single ports, for geopolitical exposure; the 2025 Middle East decline shows a whole region's ports can slip together after a shipping-lane disruption, regardless of individual port quality.
Read against the table above, the gap looks structural rather than a data error. The report ties high scores to export-oriented trade, crane intensity and inter-port competition, and low scores to import-dominated flows, capacity limits and hinterland bottlenecks. A hub that serves many ship sizes and heavy transshipment connections, such as those in our Asia ports overview, will find a vessel-time score harder to optimize than a port with a narrow, uniform call profile. That is a reason to weigh CPPI with volume and connectivity, not a reason to discount either.
Common questions
Does a low CPPI rank mean a port is badly run? Not necessarily. It means measured vessel time in port, adjusted for ship and call size, was longer than peers in 2025; complex hubs serving many ship sizes and heavy transshipment volumes find this harder to optimize than smaller, uniform ports.
What year does the CPPI 2025 edition cover? Calendar year 2025 port calls, benchmarked against a standardized series back to 2020, with 2024 as the reference year for normalization.
How many carriers and ports are covered? Ten major lines representing roughly 75 to 80 percent of global fleet capacity, feeding a ranking of 400 ports worldwide.
Is CPPI the same as a service reliability or cost index? No. It measures only vessel time in port. Schedule reliability, dwell time, and total logistics cost require separate data sources such as carrier on-time performance reports or terminal-level dwell statistics.
Why do the administrative and statistical scores sometimes differ for the same port? The administrative approach benchmarks a port directly against group averages; the statistical approach (non-negative matrix factorization) infers latent performance patterns across all ports at once. The report notes the two are highly correlated but not identical, and publishes both alongside the combined score for transparency.
Sources: World Bank and S&P Global Market Intelligence, "The Container Port Performance Index 2025: A Comparable Assessment of Performance based on Vessel Time in Port" (10 June 2026, openknowledge.worldbank.org), including its annex spreadsheet with the full 2020 to 2025 time series; World Bank and S&P Global Market Intelligence, "Methodology Note: Container Port Performance Index (CPPI)" (10 June 2026, thedocs.worldbank.org); World Bank, CPPI 2025 publication page (worldbank.org/en/topic/transport/publication/cppi); APM Terminals, "Port efficiency: keystone of global trade" (apmterminals.com, accessed 30 September 2026); DP World, "DP World's Port of Posorja Ranked Among World's Top 20 Most Efficient Container Ports for Second Consecutive Year" (23 July 2026, dpworld.com); gCaptain, "Only One U.S. Port Makes Global Top 50 as Asia and Middle East Dominate" (10 June 2026). Rankings reflect the position on 30 September 2026.