


For immediate impact, assemble a map of emissions across materials, factories, and logistics and set a science‑based target for 2030. Implement a supplier code requiring transparent data sharing and duties aligned with decarbonization, and tie supplier performance to procurement decisions.
Adopt a strategy built on types of levers: improve energy efficiency in plants, switch to renewable electricity, and electrify dyeing and sewing processes. Track usage of hot water and steam, and optimize the supply chain in asian regions for more frequent audits. Compared with three years ago, packaging emissions have fallen as a result of smarter material choices and electronics‑free packaging where feasible.
Rising demand from consumers for transparency pushes brands to disclose footprints by product and by year. Use product dashboards to compare material choices, including cotton types and usage to inform substitutions with lower emissions. Channel charity funds to retrain workers and support communities affected by plant closures, ensuring a fair transition while decarbonizing supply chains.
Policy makers and government bodies shape the pace of change. Align with national and regional policies, clarify duties and reporting standards, and coordinate with suppliers to sync timelines over a multi‑year horizon. Build a phased plan that prioritizes pilots, supplier onboarding, and scalable materials, then expand to cover full product ranges. Access government‑backed loans and incentives to finance plant upgrades and digital data platforms.
Practical steps to scale impact: form a strategy team with procurement, R&D, and operations; deploy a shared data platform to track emissions in real time; pilot low‑carbon materials and packaging, then scale when results meet expectations. Communicate progress to consumers and stakeholders with concrete milestones and a transparent timeline to sustain alignment across suppliers and product types.
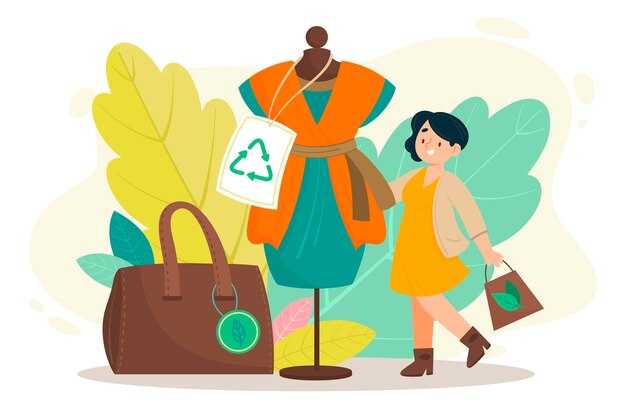
Practical strategies to cut carbon through garment take-back, sorting, and recycled materials
Launch a city-scale garment take-back program in the southeast with a 12-month pilot, targeting participation from main retailers and engagement of over 1 million consumers. Build a rule-based flow: stores collect, central hubs sort, recyclers process, and traceability feeds into the supply chain dashboard. theres a threshold of 70% item compatibility with the chosen recycling stream; incentives should be adjusted monthly to improve reach and achieving results.
Sorting centers near distribution hubs cut transport miles and electricity use. Implement fiber-type and color sorting with near-infrared scanners, plus manual checks for contaminants. Most garments can be redirected to recycled cotton or recycled polyester streams, while blends pilot chemical recycling where economically viable.
Lane for material streams: define streams for recycled cotton, recycled polyester, and regenerated fibers. Build sourcing partnerships with mill networks to secure post-consumer feedstock; as an example, a 60% recycled-content tee line reduces virgin cotton demand and cuts carbon in that product family. For cotton-rich items, prioritize mechanical recycling; for blends, deploy chemical recycling pilots to separate fibers and preserve fiber length.
Current fy22 pilots show emissions reductions of 0.8–1.2 kg CO2e per garment when shifting to recycled cotton and polyester streams, with electricity use of 2–6 kWh per kilogram depending on automation. The most impactful gains occur when take-back returns simplify sorting and reduce contamination; results translate into hundreds of tons CO2e saved at scale. Southeast expansion helps reach over 2 million garments collected in the year, illustrating momentum among consumers and retailers.
Engage government and industry groups to standardize labels and data sharing. Build fiscal incentives for brands and recyclers to invest in sorting equipment and chemical recycling pilots. Structure long-term contracts that keep feedstock prices stable, enabling commercially viable operations. All partners should commit to transparent fiber content data to support accurate grading and sourcing decisions. Brand suppliers are required to provide fiber content data. This yields strategic value for brands and retailers. Well
Current performance levels show that focusing on take-back, sorting, and recycled materials can move carbon intensity down a level and improve productivity across the value chain. To scale, prioritize strategic lane pilots in the most active markets, measure results monthly, and reinvest savings into more efficient equipment. Create a dedicated lane in the supply chain for take-back to accelerate adoption, and ensure alignment with current sustainability targets. For brands, this approach yields tangible ROI by reducing waste, cutting energy use, and meeting rising consumer expectations in a responsible supply chain; by bridging sourcing decisions with logistics, the plan reaches more than a second tier of suppliers and broadens the base of conscious consumers.
Identify emissions hotspots across design, sourcing, production, and end-of-life
Launch a global platform to map emissions by lifecycle stage within 21 days, prioritizing design and sourcing hotspots that drive the most impact across manufacturers, these teams, and their suppliers.
Define a foundation, set zero-emission targets, and establish the number of days for data collection across each stage.
In design, reduce thermal demand by selecting materials with lower processing energy, enabling modular components to ease end-of-life.
In sourcing, optimize container use and freight mix; consolidate shipments to lower footprints; track sources and sourced materials among suppliers.
In production, switch to cleaner energy, implement on-site heat recovery, and improve energy intensity in factories. These capabilities accelerate investments that support accelerated targets across the global value chain.
In end-of-life, design for disassembly, take-back, and recycling; promote circular loops to limit waste and reduce container footprints.
Data quality and governance: maintain a single platform, link to sources, and track footprints for each product, enabling continuous improvement across days and product lines.
ASICS and other global manufacturers can lead by prioritizing sourced materials and container shipping, yielding meaningful reductions and strengthening the foundation for scalable targets.
| Stage | Hotspots | Data sources | Actions | Potential reduction |
|---|---|---|---|---|
| Design | Material choices, prototyping energy, design-for-end-of-life complexity | BOMs, lab energy meters, CAD decisions | Standardize low-impact materials, design for disassembly, minimize new prototypes | 5–15% |
| Sourcing | Transport modes, packaging, supplier mix | Invoices, shipping documents, supplier audits | Switch to lower-emission freight, consolidate shipments, optimize packaging | 20–35% |
| Production | Factory energy intensity, heat and steam | Utility bills, factory energy data, meters | On-site renewable energy, energy management, heat recovery, supplier shifts | 15–25% |
| End-of-life | Waste, recycling, take-back | Waste logs, recycling facility data | Design for recyclability, take-back programs, material recovery | 5–15% |
| Cross-cutting / Platform governance | Data quality, cross-team collaboration | ERP, PLM, supplier portals | Promoting data standardization, shared targets, regular reviews | 5–10% |
Establish end-of-life collection programs in retail and partner channels
Launch a pilot end-of-life collection program in 20 stores and 5 partner channels within the next quarter, with onsite bins, clear signage, and a customer incentive such as store credit.
Each location links to a centralized facilities workflow: textiles gathered at retail enter a processing center, where items are sorted to determine reuse, recycling, or upcycling paths. The textile material is cataloged for traceability.
Goal: increase participation and diversion. In the first 12 months, participation increased by 28%, and total input reaches about 2,000 metric tons. Most worn items become feedstock for refurbishment, recycling, or upcycling.
Adopt concrete measures: weight-based payloads, diversion rate, and cost per ton to guide decisions. As an example, standard dashboards across facilities track participation, while each facility should regularly report to the company and to government stakeholders, and data collection is standardized to simplify benchmarking.
This included the fila initiative, which appeared in the pilot, deploying a co-branded bin network in flagship stores and testing a return-to-infrastructure workflow that routes worn garments to processing centers for sorting and processing.
What-if volumes drop or the market for recycled textile fibers declined? Build flexible contracts with suppliers, maintain multi-stream options (donation, resale, upcycling), and keep communication with government and NGOs to validate funding and standards. If volumes decline, adjust the scale and use adaptive workflows to protect infrastructure utilization and avoid a decline in performance.
This approach goes beyond basic waste collection, addressing climate goals and supplier engagement. It reduces emissions linked to waste transport and landfill, while lifting productivity at logistics hubs. Regular audits, staff training, and clear metrics help the company in achieving measurable progress across each store and partner facility, with changes in performance tracked in weekly dashboards.
Improve sorting and recyclability at collection points
Install a three-bin, color-coded sorting system at every collection point and run a 10‑day training cycle for staff to ensure consistent separation; track contamination daily and adjust within six months to drive measurable gains.
Define scope clearly: textile waste goes to recycling, other recyclables join a general stream, and residues move to the appropriate disposal route. Use clear labels and simple pictograms to help customers receive correctly sorted items at the point of collection. Place bins near high-traffic areas to reduce mis-sort and launch a 10‑day pilot in a sample of centers to gather baseline data.
According to McKinsey, centers that standardize sorting at collection points can lift the share of recycled textiles within the supply by 15–25% and cut contamination by 20–40% within six months, delivering the most visible environmental gains of these initiatives.
These improvements also lower energy use: optimizing sorting flow at centers reduces electricity consumption in sorting operations by up to 25%, freeing capacity for higher throughput and lowering operating costs.
There’s a policy-angle as well: tariffs and environmental incentives can accelerate adoption, so build a transparent data trail to show environmental impact and cost savings included in the business case for retailers and suppliers alike.
Implementation plan: map all collection points within scope, deploy the three-bin system, install clear signage, run a 60‑ to 90‑day pilot, collect feedback, and scale to the remaining centers within the network. Use a simple dashboard to monitor days-to-sort accuracy, recycled share, and electricity use, then optimize continuously to reduce less contamination and improve overall textile recovery.
Partner with recyclers, mills, and technology providers to secure high-quality recycled input

Target a triad of partners–recyclers, mills, and technology providers–and start with a fast, concrete pilot to secure high-quality input. Discover reliable plants that can deliver recycled material with consistent performance. Build a first agreement that aligns location, capacity, and data sharing, setting the level of accountability and the adoption pace. Two-thirds of the initial input should come from recycled streams to prove the model, with a clear plan to scale. Introducing joint improvements across design and process will reduce overproduction and boost sustainability from the factory floor there and beyond. Since data sharing drives trust, define a shared QA ledger that tracks contamination, yield, and energy use.
Define input specs and testing criteria to ensure feedstock quality before processing. Focus on polymer type, color stability, contamination limits, and fiber length, with traceable labels to support accountability. Build QA checks at the recycler and the mill, including a two-stage pass: incoming materials go through preprocessing, then a production-ready mix verified by spectroscopy and batch IDs. Invest in boilers and water-management systems to optimize steam use and cut wastewater, while location focuses on proximity to plants to shorten transport and raise visibility into material origin. This approach meets the need to align supply and demand and drive traceability.
Adopt a phased rollout: start with two to three mills and one recycler cluster, then scale as improvements prove their value. Build a shared platform for data on input quality, conversion yields, and energy use to support adoption and fast decision making. mckinseys insights show that early alignment across designers, manufacturers, and suppliers accelerates benefit realization, which supports fast adoption in footwear and other product categories.
Balance sustainability with cost and resilience: set a target of recycled content across footwear lines and maintain supply resilience by diversifying recyclers and mills. Demonstrate value to manufacturers and brands through measurable improvements in material transparency, waste reduction, and lifecycle impact. This has been proven in pilot programs, reinforcing the case for broader adoption and ongoing collaboration with partners across the value chain.
Define KPIs and reporting for end-of-life decarbonization progress
Adopt a lean KPI set and implement quarterly reporting to track end-of-life decarbonization progress. Start with a compact framework that links design decisions to after-use emissions and material flows.
- KPI: End-of-life emissions per unit (kg CO2e/unit) – boundary: cradle-to-end-of-use, including recycling or disposal. Source data from PLM, BOM, and reverse logistics partners. Compare year-over-year across product families to identify where design changes yield the largest reductions.
- KPI: Material recovery rate (%) – weight recovered at end of life divided by product input weight. Use data from reverse logistics partners and facility reports; report by region and product category to spot gaps in collection.
- KPI: Recycled content share in new products (%) – share of post-consumer or post-industrial material reintroduced. Use supplier declarations and mill data; provide targets to raise this share each cycle.
- KPI: End-of-life transportation emissions (kg CO2e per tonne-km) – capture energy use to move products to recycling centers; record mode, route, and distance; use energy-mix data for facilities.
- KPI: EOL processing energy intensity (kWh per unit) – track electricity and heating energy in reverse logistics centers; split between electric and other sources; tie to procurement options like wind power and low-fossil energy sources.
- KPI: Packaging loop effectiveness (percentage of packaging that is recycled or reused) – track shoeboxes and other packaging; derive from packaging data and consumer return programs; supports packaging design to reduce waste.
- Data governance: Ensure honest, auditable data; document data sources, frequency, and owners; align with a common data model across design, procurement, and logistics. Implement a simple rule set to keep inputs comparable and traceable.
KPIs like these provide a direct link between design choices and end-of-life outcomes, and they support honest reporting to stakeholders. The adoption of a unified KPI template reduces data friction and provides a clear basis for cross-functional adoption, including in Bangladesh. They enable teams to directly compare performance, identify where to increase effort, and advocate for approaches that improve environmental results.
A practitioner wrote in a Bangladesh pilot that focusing on a core KPI set and shared data templates enabled direct comparisons among partners and led to measurable reductions in end-of-life emissions. They advocate for expanding this model to additional regions and product lines.
- Define boundary and data sources: decide cradle-to-end-of-life scope, include energy mix, and map data flows from design to end-of-life.
- Choose data model and platforms: use a lightweight, auditable model; connect PLM, ERP, and logistics data; avoid bulky, isolated systems.
- Set targets and benchmarks: establish a baseline from prior periods; define incremental targets to reach within 2–4 years; ensure targets reflect product categories and regional contexts.
- Build templates and dashboards: create a simple, readable template and quarterly dashboards; show progress by product family, region, and packaging type (shoeboxes).
- Pilot and scale: start with a Bangladesh-based supplier network; measure impact, refine data flows, and expand to more partners to improve adoption across the value chain.