


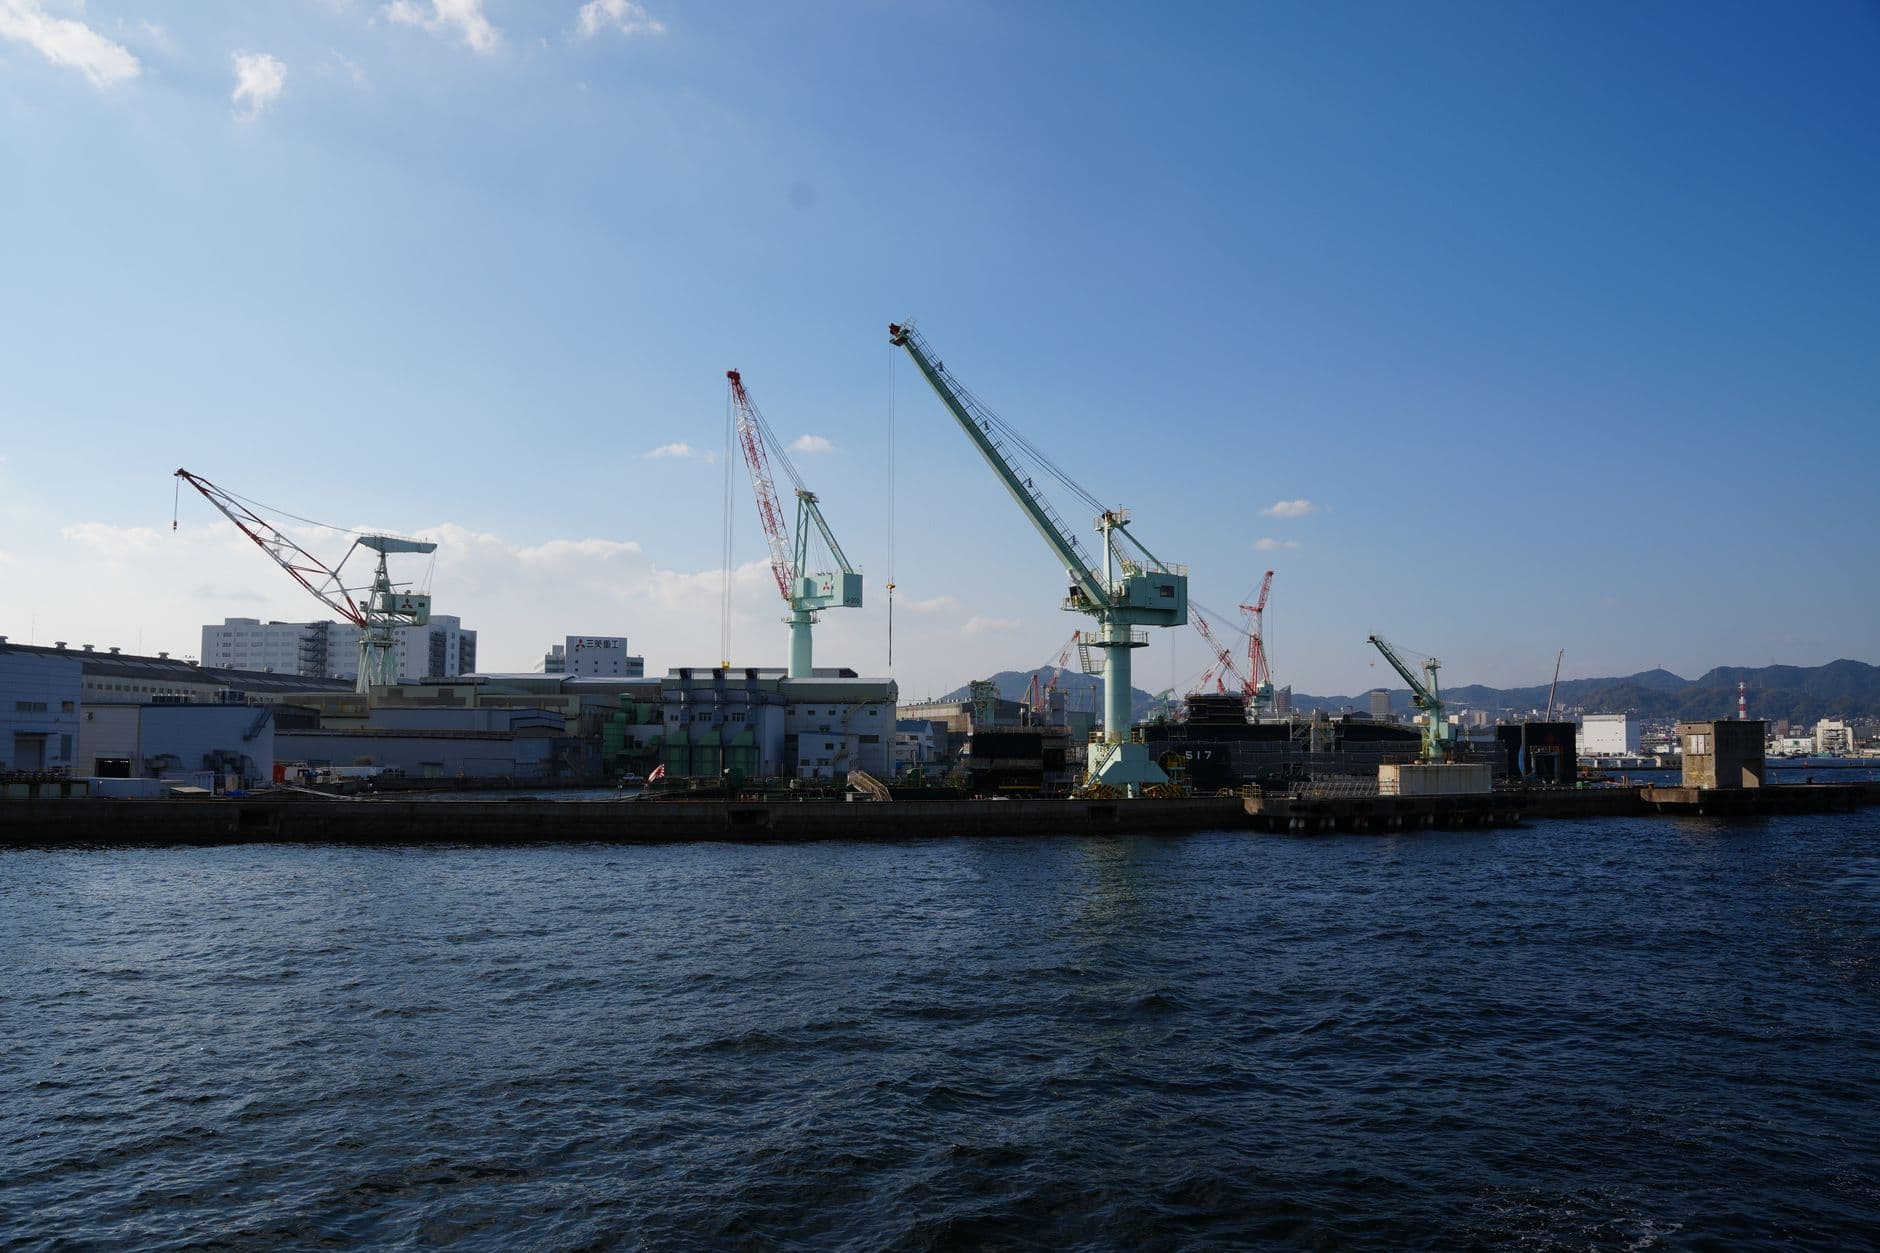

China is the largest shipbuilder in the world in 2026 by every measure, but the size of its lead changes with the yardstick: 65 percent of the standing orderbook, 72 percent of first-half new orders by compensated gross tonnage, and 82.3 percent by deadweight. That spread of 17 points is not noise. It tells you what kind of ships each country is building.
I started paying attention to these numbers when a client's newbuild slot slipped and the charter market decided the outcome of his year. Shipbuilding statistics look like trade-press trivia until the orderbook is the thing setting your freight rate two years out, at which point the composition of that orderbook matters more than its size.
The standing orderbook: 207 million CGT
The global orderbook reached 207 million CGT, equal to 21 percent of the existing world fleet, the highest share since 2011. As of the end of June 2026 it splits with China holding 134.03 million CGT for a 65 percent share and South Korea 38.81 million CGT for 19 percent.
An orderbook at 21 percent of the fleet is a statement about capacity arriving in 2027 and 2028 rather than about today. Every one of those ships was contracted against somebody's view of future demand, and they will deliver whether or not the view proves right. For anyone buying freight on a multi-year horizon, this single figure is the most useful number in shipbuilding.
I keep it in the same note as my rate history, because the two move together with a lag of roughly two years. When I have been wrong about where rates were heading, it was usually because I read the spot market and ignored what had already been contracted at the yards.
New orders in the first half of 2026
The flow of new business is where the market moved hardest. Global newbuilding orders rose 66 percent year on year to 42.95 million CGT across 1,481 vessels in January to June 2026, against 25.90 million CGT and 1,101 vessels a year earlier, per Clarksons Research.
| Builder nation | H1 2026 new orders (CGT) | Vessels | Share by CGT | Change y/y |
|---|---|---|---|---|
| China | 31.00 million | 1,131 | 72 % | +113 % |
| South Korea | 7.97 million | 195 | 19 % | +60 % |
| Rest of world | ~3.98 million | 155 | ~9 % | n/a |
| Global total | 42.95 million | 1,481 | 100 % | +66 % |
The gap between China and South Korea in first-half order share came to 53 percentage points. On a deadweight basis Chinese yards booked a record 121.06 million dwt, up 173.1 percent year on year, which works out at 82.3 percent of global ordering by that measure.
Why the same market gives 65, 72 and 82 percent
Three measures, three answers, and each is measuring something real:
- Deadweight counts what a ship can carry. It flatters whoever builds bulk carriers and tankers, because a capesize holds enormous tonnage and is comparatively simple steel.
- Compensated gross tonnage adjusts for construction complexity, so a gas carrier or a large containership counts for more per tonne than a bulker. It is the measure the industry uses to compare yard workload.
- Vessel count ignores both. China's 1,131 vessels against Korea's 195 is the starkest ratio of the three and the least informative on its own.
A fourth measure changes the picture again, and it is the one that describes the present rather than the future. China's share of deliveries in the first half of 2026 was 55.4 percent, against 73.9 percent of new orders and 63.3 percent of the standing orderbook on the same national statistics. Deliveries reflect what was contracted two or three years ago, orders reflect what arrives in 2028 and 2029, and the 18-point gap between them is the speed at which the industry is still shifting toward Chinese yards.
Those national figures also explain why published shares differ by a point or two between sources. Clarksons puts China's first-half order share at 72 percent, Chinese industry statistics at 73.9 percent, and both are defensible depending on how vessel types and small yards are counted. Treat any single decimal place in this market with suspicion.
Put them together and the picture sharpens: China's lead is widest in simple tonnage, narrower in complexity-adjusted terms, and Korea's 19 percent of CGT off only 195 hulls tells you Korean yards are taking the technically demanding work. That is deliberate. Korean builders have been selective, optimising for margin rather than volume, and their order intake still rose 60 percent.
The groups doing the building
China State Shipbuilding Corporation is the largest shipbuilding group in the world, and its Shanghai cluster shows what that means in practice. Jiangnan Shipyard, Hudong-Zhonghua Shipbuilding and Waigaoqiao Shipbuilding delivered 28 vessels between them in the first six months of 2026 and had more than 79 under construction.
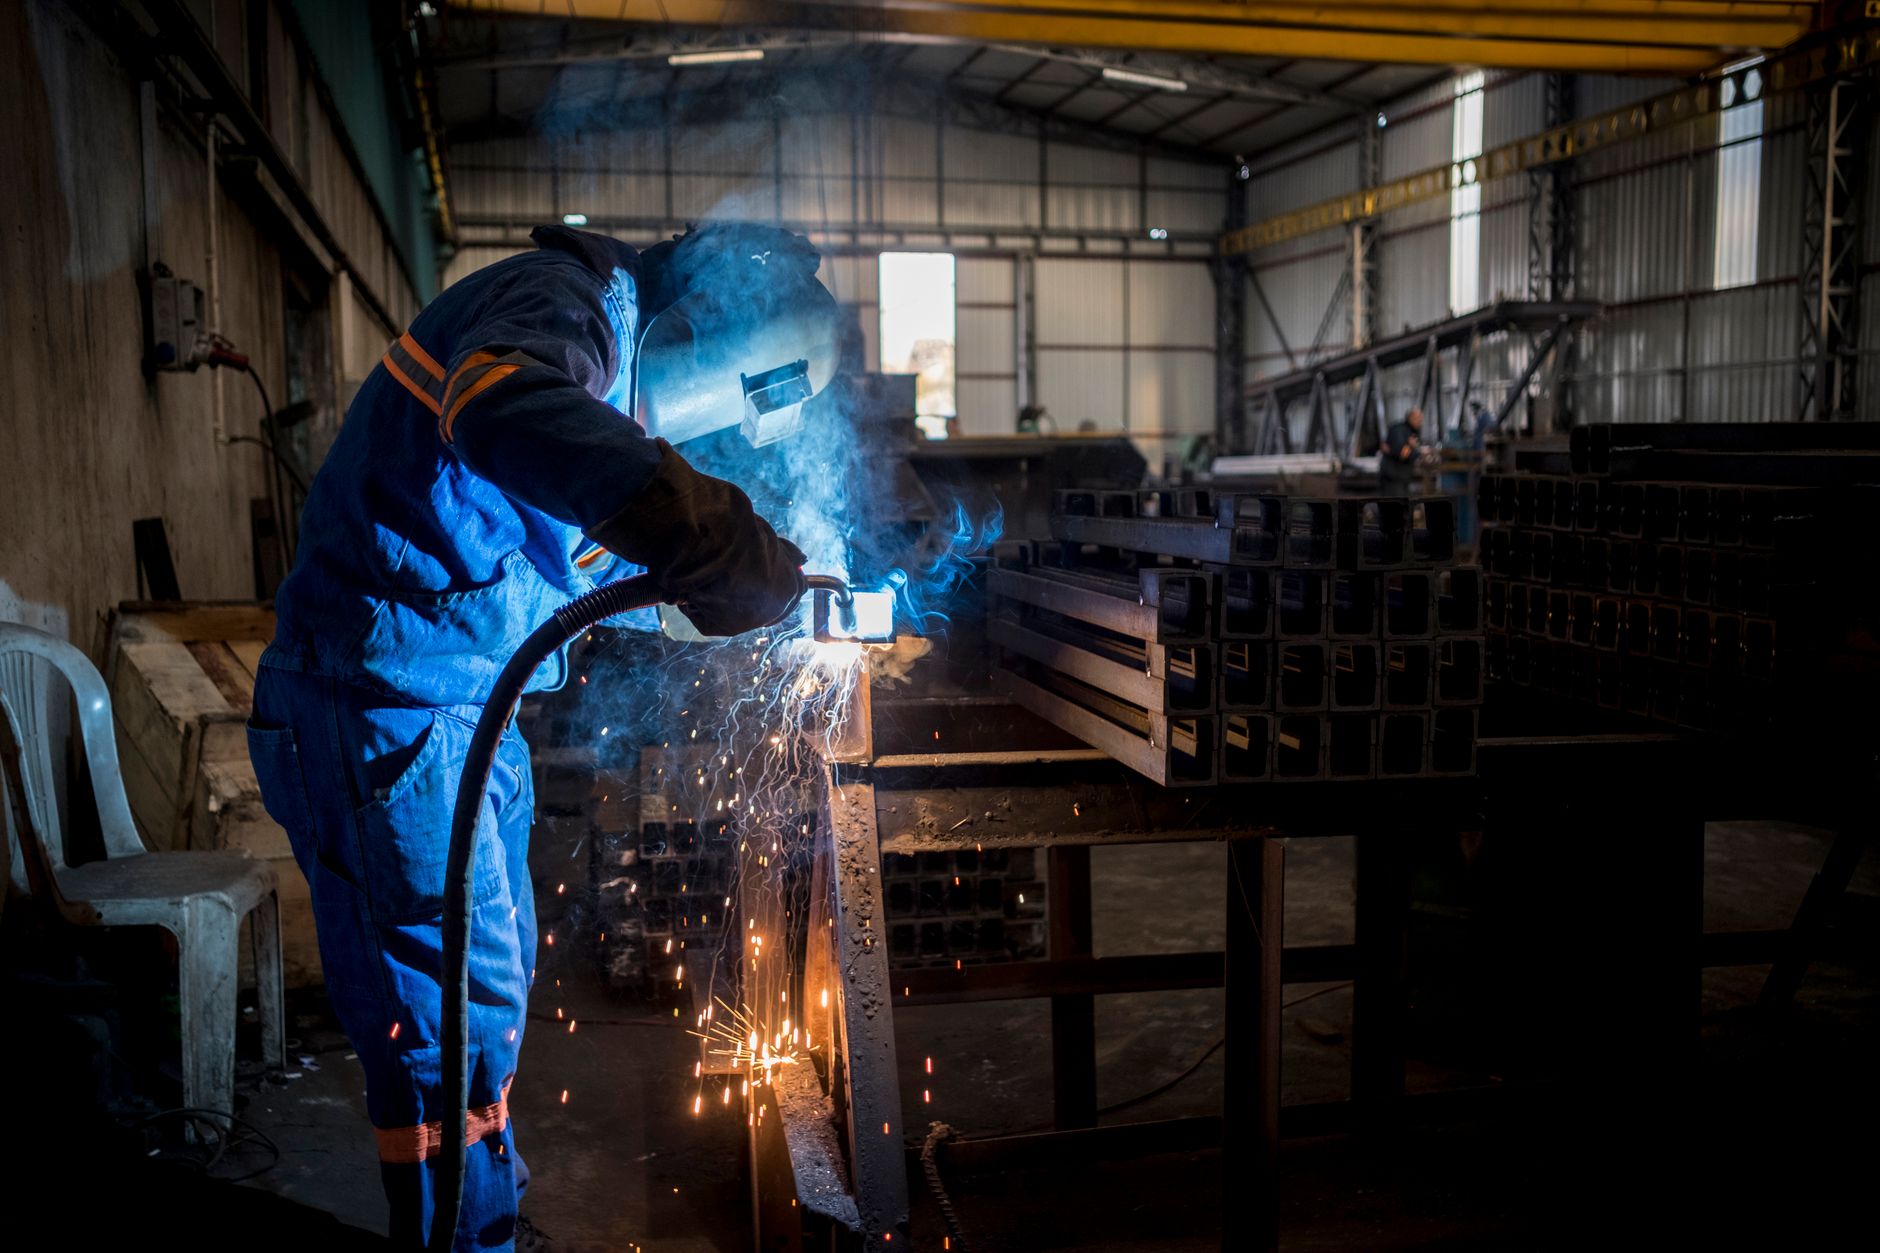
HD Hyundai is the largest builder outside China, with an order target of USD 17.03 billion for 2026 and a first quarter that brought in 60 vessels worth USD 6.39 billion, after merging HD Hyundai Heavy Industries and HD Hyundai Mipo into a single business unit. Consolidation of two yards into one commercial front is a response to exactly the pressure the CGT figures describe.
New Times Shipbuilding has ranked among the top three yards globally by order volume, and it is privately owned, which is worth noting given how often Chinese shipbuilding is discussed as a purely state programme.
Hanwha Ocean and Samsung Heavy Industries complete the Korean big three, both active in high-value segments including naval and gas work.
Hengli Heavy Industries is the newcomer I watch most closely. It signed a patent agreement with GTT for membrane containment, positioning it to become the sixth Chinese yard, and the second privately owned one, able to build large LNG carriers.
Gas is the segment where the national shares invert, and it is worth being precise about it. Of the 59 large LNG carriers ordered globally in the first half of 2026, Korean yards took 36 and Chinese yards 23, a split of 62 to 38 percent. Korea still leads the ship type that pays best, which is the clearest evidence that its 19 percent of overall CGT is a choice rather than a limit.
Price tells the same story. Jiangnan took an order for 4 large LNG carriers from ADNOC at roughly USD 225 million each, while HD Korea Shipbuilding was reported at about USD 252 million per vessel for a Greek owner. A gap of some USD 27 million on an identical ship type is what the market currently pays for a Korean build slot. Note also that both yards license the same technology: large LNG carriers built in China use GTT membrane containment under patent, with royalties paid accordingly.
That shift matters for gas buyers specifically, and it lines up with the fleet picture in our ranking of the largest LNG shipping companies, where the biggest committed orderbook belongs to a Qatari owner building in China.
Japan, and the long tail
Japan is the third shipbuilding nation, at roughly 11 percent of global CGT-based completions in 2024. The Japanese industry builds heavily for Japanese owners, which insulates it from the order-share swings that dominate the China and Korea comparison and also caps its upside.
Everyone else together holds under 10 percent. European yards remain competitive in cruise, naval and specialist tonnage, none of which shows up meaningfully in a CGT ranking of merchant construction.
What a cargo buyer should take from a shipyard ranking
Yard league tables get read as national scoreboards. The useful reading is different:
- Delivery timing sets future capacity. An orderbook at 21 percent of the fleet means real supply growth in 2027 and 2028, and supply growth is what eventually loosens rates.
- Segment matters more than the total. Tanker-heavy ordering says nothing about container capacity on your lane. Ask which ship types the orders are for.
- Slot scarcity is a price signal. When yards are full, newbuild prices rise, and a higher construction cost raises the rate a new ship must earn for years afterwards.
- Where a ship is built is becoming a commercial variable. Port fee proposals aimed at Chinese-built tonnage mean the yard of origin can affect the cost of calling somewhere, which was not a consideration a few years ago.
- Concentration is a risk factor. With over 70 percent of complexity-adjusted orders in one country, a disruption there is a disruption to the whole delivery pipeline.
What the three rankings agree on
China leads all three measures and will keep leading for the length of the current orderbook, because ships ordered in 2026 deliver into 2028 and beyond. Korea's position is narrower and higher up the value chain, Japan's is stable and domestically anchored, and the interesting movement is in ship type rather than in national share: gas carrier construction shifting toward Chinese yards is a bigger change than another few points of headline percentage.
If you follow the tonnage from the yard to the trade, the segment rankings pick up where this one stops: container ships and lines for manufactured cargo and tanker owners for the segment currently driving the orderbook to its highest share of the fleet since 2011.
Frequently asked questions
Which country builds the most ships in 2026?
China. It holds 65 percent of the standing orderbook at 134.03 million CGT, took 72 percent of first-half 2026 new orders by CGT, and 82.3 percent by deadweight. South Korea is second on 19 percent of orders by CGT.
What is CGT and why is it used instead of tonnage?
Compensated gross tonnage weights a ship by how much work it takes to build, so a gas carrier counts for more per tonne than a bulk carrier. It is the fairer way to compare yard workload, which is why China's share is 72 percent on CGT and 82.3 percent on deadweight.
Who is the largest shipbuilding company in the world?
China State Shipbuilding Corporation, whose Shanghai yards alone delivered 28 vessels in the first half of 2026 with more than 79 under construction. HD Hyundai is the largest builder outside China, targeting USD 17.03 billion of orders in 2026 after booking 60 vessels worth USD 6.39 billion in the first quarter.
Does a record orderbook mean freight rates will fall?
Eventually and unevenly. An orderbook at 21 percent of the fleet points to meaningful capacity arriving in 2027 and 2028, but it is concentrated in particular segments, so a tanker-led orderbook does little for container or gas rates.
Orderbook and new-order figures are Clarksons Research data for the first half of 2026 and the orderbook position at end-June 2026. Deadweight and CGT shares measure different things and are not interchangeable. Company order targets are management guidance rather than booked volume, and yard delivery counts change monthly.