




Port Hedland shipped 571.6 million tonnes of iron ore in the year to June 2026, roughly 75 percent of everything the Pilbara exported. No other bulk terminal on earth moves that volume through one channel. The ranking below covers iron ore plus coal, the two trades that set dry bulk freight rates.
I have kept both commodities in one table because owners fix the same Capesize tonnage against each of them, and because the contrast matters. Iron ore concentrates into a handful of enormous berths, while coal spreads across many mid-sized ones. That structural difference explains why an outage at one iron ore berth moves the market and an outage at one coal berth usually does not.
The largest bulk export terminals in 2026
| # | Terminal | Commodity | Volume, million tonnes |
|---|---|---|---|
| 1 | Port Hedland, Australia | Iron ore | 571.6 of ore in the 12 months to June 2026, inside 580.4 of total cargo |
| 2 | Dampier, Australia | Iron ore | 178.3 in the 2025 to 2026 financial year |
| 3 | Newcastle, Australia | Coal | 149.19 of coal exports during 2025, inside above 160 overall |
| 4 | Ponta da Madeira, Brazil | Iron ore | 69.4 in the first half of 2026, near 139 annualised on my own arithmetic |
| 5 | Richards Bay, South Africa | Coal | 91 of installed capacity, above 60 targeted this year |
| 6 | Tubarao, Brazil | Iron ore | 39.1 during January to June 2026 |
| 7 | Gladstone, Australia | Coal | 6.35 in June 2026 alone, up 0.4 percent year on year |
| 8 | Dalrymple Bay, Australia | Metallurgical coal | 6.04 that same month, down 5.8 percent |
| 9 | Saldanha, South Africa | Iron ore | Licensed at 60 yearly, handling about 96 percent of South African ore shipments |
| 10 | Hay Point, Australia | Metallurgical coal | 4.14 in June 2026, down 2 percent |
Pilbara Ports, the authority covering Port Hedland, Dampier plus Ashburton, moved 804.1 million tonnes in the 2025 to 2026 financial year, beating its previous record of 775.7 million. Iron ore accounted for 759.4 million tonnes of that total. Those three harbours ship more dry bulk than most continents, which is why Capesize earnings track Western Australian sailings so closely. The owners who carry the cargo are ranked in our list of the largest dry bulk shipping companies.
Port Hedland is one channel with no alternative
BHP moved a record 256.9 million tonnes of iron ore from its Western Australian operations in the financial year to June 2026, and every tonne left through Port Hedland. There is no second berth group, no bypass route plus no partial rerouting at meaningful scale. Ore leaves the Pilbara through a dredged channel that loaded vessels transit on tide windows, and the tide does not negotiate.
That concentration was tested on 17 July 2026, when roughly 200 workers, about 44 percent of a terminal workforce of around 450, stopped work for eight hours. Reporting at the time called it the first industrial action in the Pilbara resources sector in decades. Eight hours is not a supply shock. Loadings continued, industry reporting found no material interruption to shipments, and brief stoppages historically move iron ore futures by 1 to 3 percent. The threshold I watch is five trading days: past disruptions longer than that pushed mills into secondary procurement, and prices then reacted properly.
The queue is where the cost landed, and it is measurable. Waiting time off Port Hedland stayed elevated at roughly 8.7 days in late July 2026, well after the eight hour action had ended, so the market paid in demurrage rather than in absent cargo. Talks between BHP and the unions carried on after the stoppage, which keeps a repeat plausible for the rest of the year.
For anyone chartering into the Pilbara, that sequence is the exposure worth modelling. Cyclone season already forces periodic evacuation of the anchorage, and a labour dispute layered onto a weather clearance backlog is how a one-day event becomes a two-week laycan problem.
Brazil loads the same ore onto a much longer voyage
Ponta da Madeira loaded 69.4 million tonnes in the first six months of 2026 and Tubarao 39.1 million, with Brazilian iron ore exports decelerating through the year. Both terminals serve Vale, and both feed a very different freight equation than Australia does. A Capesize sailing from Ponta da Madeira to Qingdao covers roughly three times the distance of a Port Hedland voyage, so Brazilian volumes absorb far more tonne miles per tonne shipped.
That is why a ranking by raw volume understates Brazil. Measured in tonne miles, which is what actually consumes vessel capacity, the Atlantic terminals punch well above their loading figures. When Brazilian volumes rise while Australian volumes hold flat, Capesize rates firm even though total seaborne trade has barely moved. I read any Brazilian export slowdown as a bearish freight signal before it becomes a bearish ore signal.
Coal: Newcastle leads, Richards Bay is climbing back
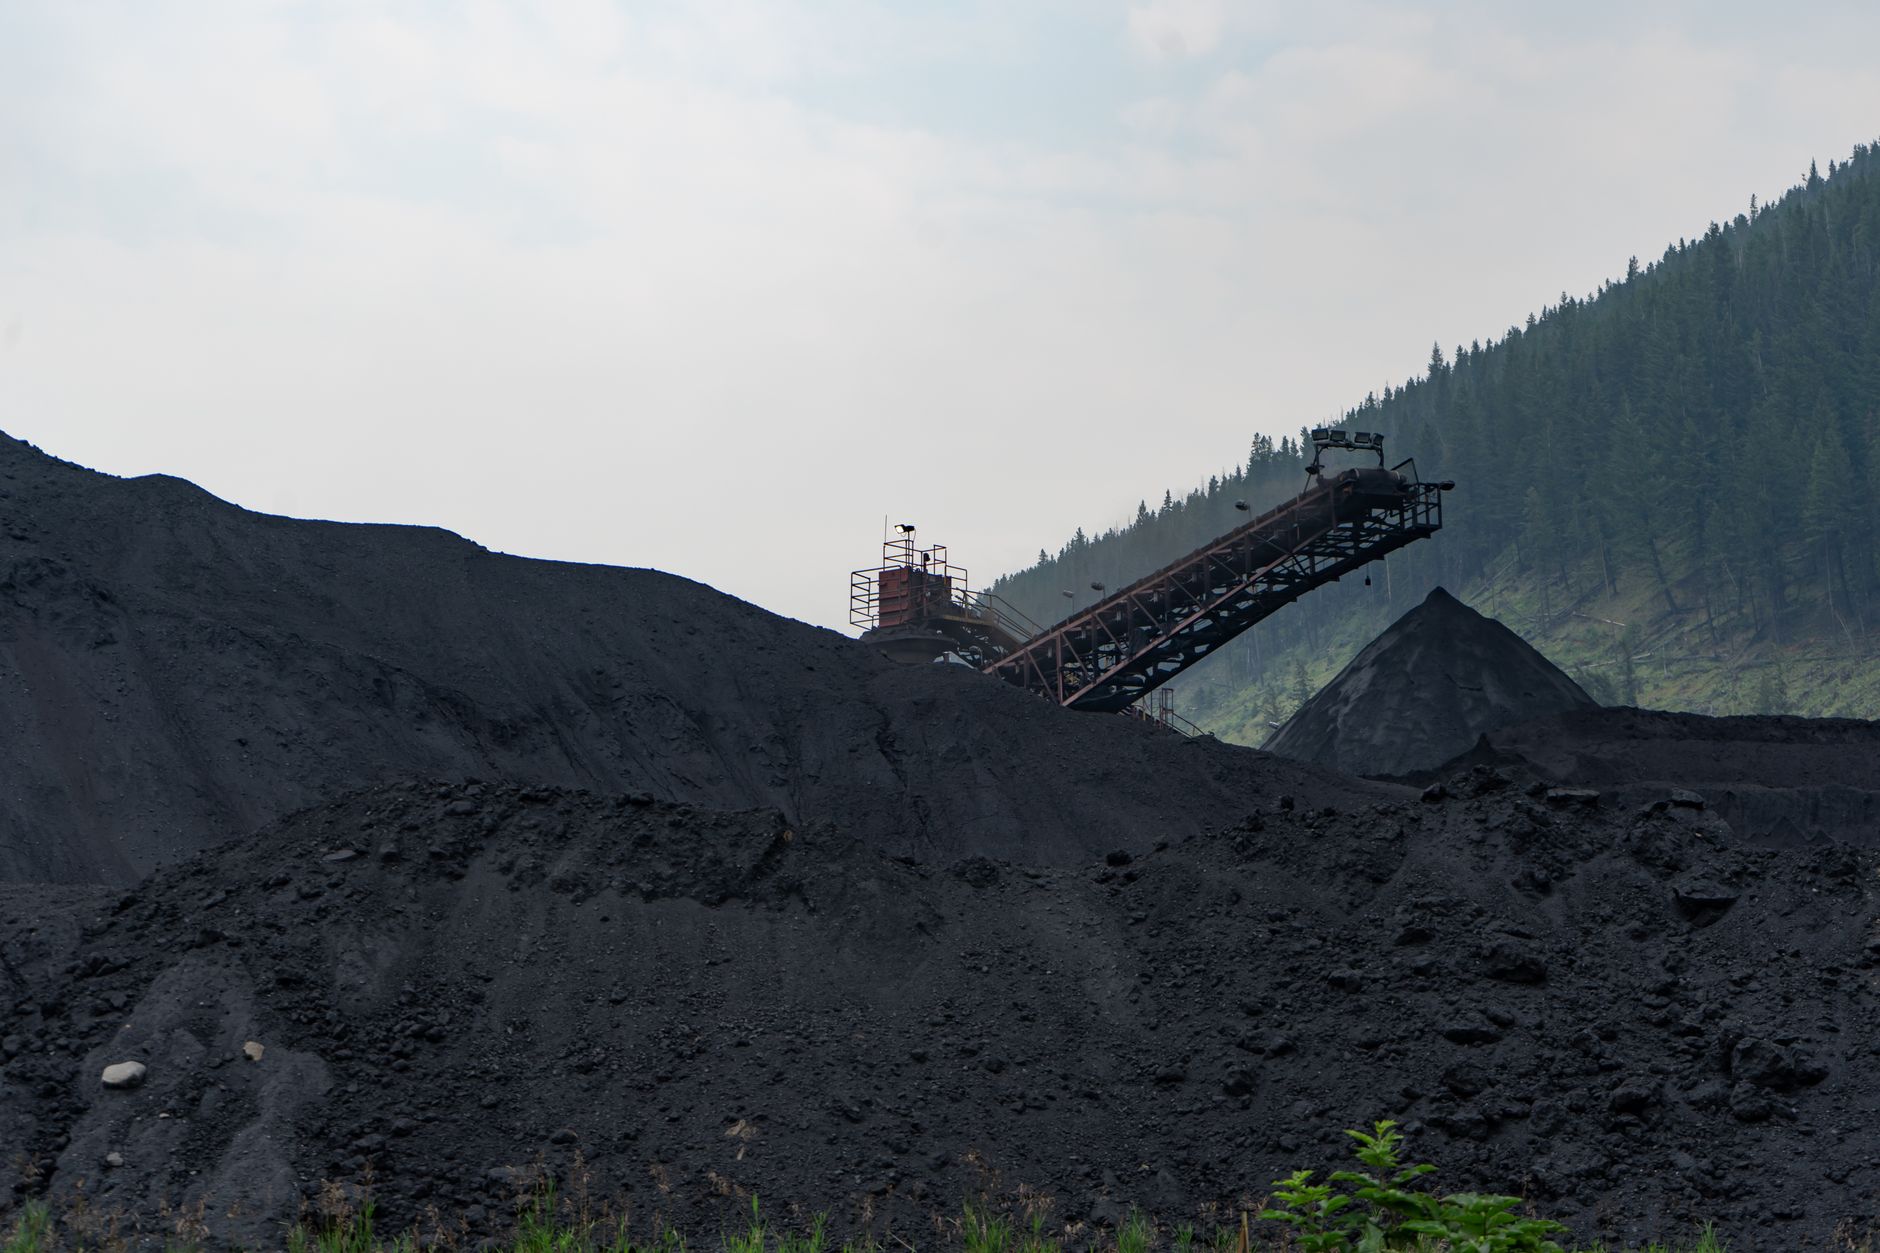
Newcastle handled more than 160 million tonnes of cargo in 2025, of which 149.19 million tonnes was coal, alongside a record 11.12 million tonnes of non-coal trade. Inside the port, the Newcastle Coal Infrastructure Group terminal carries 66 million tonnes a year of installed capacity with approval to lift maximum throughput toward 79 million.
Queensland spreads its coal across four terminals instead of one. In June 2026 they moved 19.64 million tonnes between them, up 13.6 percent on May yet only 0.1 percent higher year on year: Gladstone 6.35 million, Dalrymple Bay 6.04 million, Hay Point 4.14 million plus Abbot Point 3.1 million. May had come in at 17.28 million. Vessel queues off the Queensland coast stayed stubbornly high through that period, which tells you the binding constraint sits in rail haulage and stockpile management rather than in berth capacity.
Richards Bay is the recovery story. The terminal holds 91 million tonnes of installed capacity, exported over 10 percent more coal in 2025 than the year before, and its chief executive said more than 60 million tonnes was achievable in 2026, with a consistent 65 million tonne annual rate by the end of the year. Read those figures together and the gap is stark: a terminal built for 91 million is planning around 65 million. The missing tonnage is a rail problem, not a quay problem, and Transnet performance is the variable worth tracking.
How to read a bulk terminal ranking
Three measurement traps make published bulk rankings disagree, and all three caught me while assembling this one.
Before the traps, a note on what the tonnage actually describes. Iron ore leaves these quays as lump, fines, sinter feed or pellet feed, each with a different stowage factor, and coal splits between coking grades sold on rheology plus thermal grades sold on calorific value and ash content. Quantity is settled by draught survey, not by the shiploader counter, so the figure a terminal publishes and the figure a receiver pays against can differ by a fraction of a percent. Berth throughput depends on the reclaimer and stacker fleet behind the quay far more than on the number of berths, and a single bucket-wheel machine under maintenance costs more loading hours than most weather delays.
Exports are not throughput. Qinhuangdao in China has around 414 million tonnes of handling capability, which would place it near the top of any tonnage table, yet the coal moving across its quays is domestic cargo railed from northern mines and shipped to southern power stations. It is a coastal transfer hub, not an export gateway, so it does not belong in an export ranking at all.
Reporting periods differ. Australian ports publish on a July to June financial year while Brazilian, South African plus Chinese figures are usually calendar year. Comparing Port Hedland's 580.4 million tonnes against a calendar 2025 figure elsewhere compares two different 12 month windows and quietly rewards whichever port had the better half.
Capacity is not volume. Saldanha handles roughly 96 percent of South African iron ore exports and is licensed at 60 million tonnes a year, with an application pending to raise its air emission licence to 76 million and a replacement tippler being commissioned by Transnet. None of those numbers tell you what actually shipped last year.
- Check the reporting period before comparing. Australian financial year against calendar year is the commonest error in bulk tables.
- Separate installed capacity from actual loadings. Richards Bay at 91 million capacity against a 65 million target is the clearest case in this ranking.
- Ask whether a terminal exports or transfers. Chinese coal ports handle enormous volumes without exporting a tonne.
- Watch the rail leg, not the berth. Queensland queues plus South African shortfalls both trace back to inland haulage.
- Price tonne miles, not tonnes. A tonne from Brazil consumes about three times the vessel capacity of a tonne from the Pilbara.
Bulk terminals sit at the deep end of the draft table, because Capesize and Valemax hulls need water that most container ports never provide, a pattern visible in our ranking of the deepest ports in the world. Agricultural bulk follows entirely separate loading geography, which we cover in the largest grain export ports.
Common questions
What is the largest bulk export terminal in the world in 2026? Port Hedland in Western Australia. It shipped 571.6 million tonnes of iron ore in the year to June 2026 and 580.4 million tonnes of total cargo, more than triple the volume of the next largest iron ore terminal.
Which is the largest coal export terminal? Newcastle in New South Wales, with 149.19 million tonnes of coal exports in 2025. Richards Bay in South Africa holds larger single-terminal installed capacity at 91 million tonnes a year but currently ships well below it.
Did the July 2026 Port Hedland stoppage disrupt iron ore supply? Not materially. The action on 17 July 2026 lasted eight hours, involved about 200 of roughly 450 terminal workers, and loadings continued. The lasting effect was the queue: waiting time off the port held near 8.7 days in late July, so the cost surfaced as demurrage rather than as lost tonnes.
Why do bulk terminal rankings differ so much between sources? Because sources mix financial year with calendar year figures, quote installed capacity instead of loadings, and sometimes include domestic transfer ports such as Qinhuangdao alongside genuine export gateways. I check all three points before comparing any two terminals.
Sources: Pilbara Ports Authority trade statistics for the 2025 to 2026 financial year, BHP operational review to June 2026, Port of Newcastle trade reporting for 2025, Newcastle Coal Infrastructure Group terminal disclosures, North Queensland Bulk Ports plus Gladstone Ports monthly coal figures for May and June 2026, Vale terminal shipment data for the first half of 2026, Richards Bay Coal Terminal management statements, Transnet Saldanha project releases, plus contemporary reporting on the 17 July 2026 Port Hedland stoppage. Monthly bulk volumes move with weather and rail availability, so treat single-month figures as indicative.