


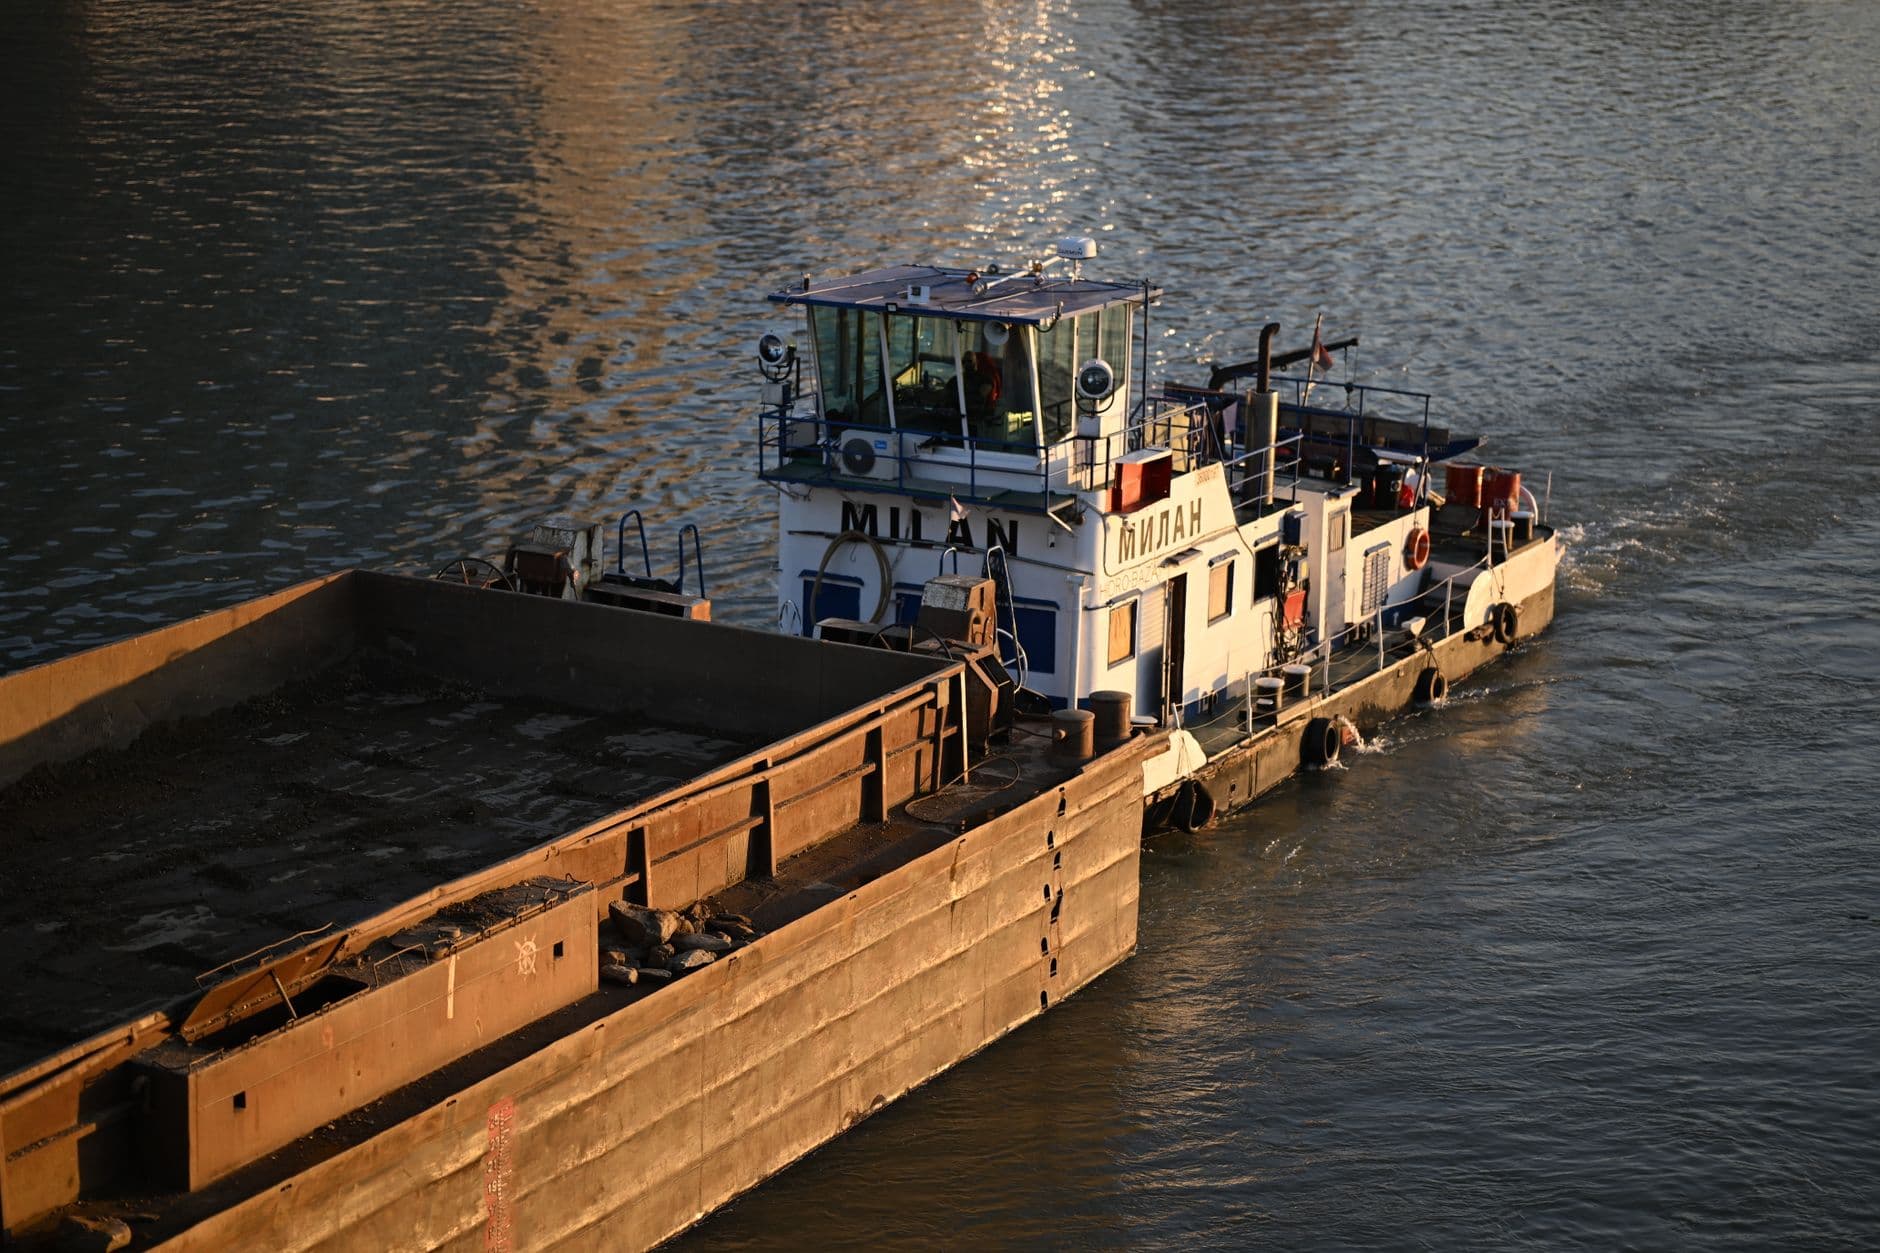

The Yangtze is the busiest inland waterway in the world by a margin nothing else approaches: ports along its trunk line handled 1.97 billion tonnes in the first half of 2026 alone. The Rhine, Europe's equivalent, moves roughly 285 million tonnes a year, and the whole United States inland and intracoastal system carries about 630 million tonnes. Those are the rankings. They are also, right now, close to useless for planning a shipment.
When I price barge capacity, the first figure I look up is not annual tonnage but a gauge reading. On 3 August 2026 the Kaub gauge on the Rhine sat at 25 cm, matching the 2018 record low, and by the end of July Germany's NIWIS hydrological information service had 44 percent of Rhine measuring stations reporting extremely low water. Barges on the corridor were running about 20 percent full. Tonnage tables tell you where the freight normally goes. The gauge tells you what you can actually load this week.
The busiest inland waterway systems, ranked
| # | System | Region | Annual freight | What sets the ceiling |
|---|---|---|---|---|
| 1 | Yangtze | China | ~4.2 bn t trunk line (2025) | Lock and channel capacity, not water |
| 2 | US inland and intracoastal | United States | ~630 m t | Ageing locks, seasonal drought |
| 3 | Mississippi | United States | 192 m t (2025) | Low-water events on the lower river |
| 4 | Rhine | Northwest Europe | ~285 m t | Kaub gauge on the free-flowing middle river |
| 5 | Danube | Central and Southeast Europe | Well below Rhine volumes | Fragmented fairway maintenance |
| 6 | Paraná and Paraguay | South America | Regional grain and container flows | Dredging programme, draft limits |
Two things stand out. The Yangtze is not merely first, it is first by roughly an order of magnitude over any single European or American river. And the constraint differs by system: China's ceiling is infrastructure, Europe's is rainfall, and America's is a mix of lock age and summer drought.
Yangtze: scale that changes the comparison
China's Ministry of Transport put throughput on the Yangtze trunk line at around 4.2 billion tonnes for 2025, and the first half of 2026 came in at 1.97 billion tonnes, with container volumes up 3.9 percent to 14.218 million TEU. It has held the title of world's busiest inland waterway for years, and the reason is structural rather than hydrological: the river connects the industrial interior to the coastal container gateways, so inland tonnage and ocean throughput feed each other.
That coupling is the part worth borrowing. Several ports near the top of our ranking of the busiest container ports owe part of their box count to river feeder traffic arriving from upstream. A river system at this scale is not a separate mode competing with the sea leg, it is the first hundreds of kilometres of the sea leg.
The Rhine in August 2026: what 25 cm does to a barge
The Rhine carries roughly 285 million tonnes a year, about 80 percent of all German inland waterway freight, and it is the clearest illustration of why a tonnage ranking hides the operational risk. Its normal payload economics are excellent and its bad-week economics are brutal. The reason is geographic rather than general: the upper river through Switzerland and the French Upper Rhine is regulated with locks, but the middle Rhine past Kaub runs free, so on the stretch that every Rotterdam-to-Ruhr booking crosses there is nothing holding water back.

Here is the 2026 low-water event in figures. Average payloads on the corridor fell to roughly 800 tonnes against a typical 5,100 tonnes, so an operator needed more than six barges to move what one used to carry. Tanker barge rates from Rotterdam to Karlsruhe rose to about €145 to €150 per tonne, from around €45 at the end of June. On dry cargo south of Kaub, quotes approached €150 per tonne against roughly €20 in normal conditions, a multiple of seven.
The contractual mechanics matter as much as the rate. Below about 81 cm at Kaub, operators generally stop granting loading guarantees, which means the tonnage on your booking becomes an estimate rather than a commitment. Low-water surcharges then step up as the gauge falls. We covered an earlier round of the same pattern when low water disrupted Rhine shipping, and the sequence repeats closely enough to plan against.
Mississippi: tonnage, ton-miles and a recurring autumn problem
The Mississippi is reported to have moved 192 million tonnes in 2025, a figure that should be treated as provisional until the US Army Corps of Engineers publishes its final waterborne commerce figures. Its 2022 figure of 257 million tonnes and about 148 billion ton-miles shows both the range between years and why ton-miles is the better measure for a river of this length: cargo travels far, so freight turnover outstrips raw tonnage. The Ohio follows at roughly 46.8 billion ton-miles and the Illinois at 18.0 billion.
The efficiency argument for barge is genuinely strong. One barge carries the equivalent of about 15 railcars or 60 trucks, which is why grain exporters accept the seasonal risk instead of moving to rail permanently. The risk itself is well documented: repeated low-water autumns have squeezed export margins, as we reported when low river levels hit farm income.
The river ports that rank on their own
| Port | River | Throughput | Why it matters |
|---|---|---|---|
| Duisburg | Rhine | Over 100 m t, over 4 m TEU | World's largest inland port, rail-and-barge hub for the Ruhr |
| South Louisiana | Mississippi | 251.4 m short tons (2024) | Grain and bulk gateway, up from 217.5 m in 2023 |
| Nanjing | Yangtze | Major upstream trunk-line port | Seagoing access far inland |
| Paranaguá and Antonina | Paraná state | 34.44 m t in H1 2026, up 0.6% | Brazil's grain and vehicle corridor |
Duisburg is the one that surprises people. An inland port handling over 4 million TEU puts it in the same conversation as mid-sized coastal gateways, and it does so on barge and rail alone. Paranaguá's record half-year, meanwhile, is part of the wider South American picture we set out in the busiest ports in Latin America.
Draft risk: the metric no ranking publishes
Every table above measures what a waterway carried. None measures how reliably it can carry it, and that is the number a shipper needs. A practical way to think about draft risk on a corridor:
- Regulation versus free flow. Locked and regulated stretches hold water through dry spells. Free-flowing middle sections, like the Rhine at Kaub, translate rainfall into payload almost immediately.
- Gauge sensitivity. Ask how many tonnes come off the barge per 10 cm of gauge. On the Rhine the answer turns a 5,100 tonne payload into 800 tonnes over a summer.
- Contract wording. Loading guarantees, not headline rates, decide who absorbs a bad month. Find the gauge threshold at which yours lapses.
- Surcharge mechanics. Low-water surcharges escalate in steps, so the cost curve is not linear with the water level.
- Modal fallback. The rail and road capacity that absorbs displaced barge cargo is finite and prices accordingly, which is why the switch has to be arranged before the gauge falls, not after.
- Air draft and locks. Bridge clearance and lock dimensions cap vessel size independently of water depth, and on ageing systems lock outages are their own risk.
How the ranking should change your planning
Use the tonnage ranking to understand where inland capacity exists, then price the corridor on its worst realistic month rather than its average. On the Rhine that means budgeting for a summer where payload drops by four fifths. On the Mississippi it means an autumn plan for grain. On the Yangtze it means treating the river as part of your ocean transit time, because congestion upstream lands on your box at the coast.
The comparison with man-made chokepoints is instructive. Canals ration transits by auction and slot, which at least produces a price signal you can plan around, as we set out in the ranking of the biggest and busiest canals. A river rations by physics and gives no notice beyond a hydrological forecast.
Frequently asked questions
What is the busiest inland waterway in the world?
The Yangtze in China. Ports along its trunk line handled 1.97 billion tonnes in the first half of 2026, and China's transport ministry put 2025 trunk-line throughput at about 4.2 billion tonnes, far ahead of the Rhine's roughly 285 million tonnes a year.
What is the largest inland port in the world?
Duisburg on the Rhine, handling over 100 million tonnes and more than 4 million TEU a year, which puts it ahead of many coastal container ports despite having no sea frontage.
How much cargo does a barge lose in low water?
On the Rhine in 2026, average payloads fell to about 800 tonnes from a typical 5,100 tonnes, with vessels running near 20 percent of capacity. Rates responded in proportion: dry cargo south of Kaub moved from roughly €20 per tonne to close to €150.
At what water level do Rhine barges stop guaranteeing loading?
Around 81 cm at the Kaub gauge is the level commonly cited by operators for withdrawing loading guarantees, with low-water surcharges rising in steps below that. The exact threshold and surcharge table vary by carrier, so check the current notice rather than a general figure.
Inland freight figures come from national waterway authorities and river commissions, including the Central Commission for the Navigation of the Rhine and the US Army Corps of Engineers, and are reported variously in metric tonnes, short tons and ton-miles, which is why totals for the same river differ between sources. Water levels and the rates tied to them change daily during a low-water event: the Kaub readings and barge quotes cited here describe late July and early August 2026 and should be checked against the current gauge and carrier notice before fixing cargo.