


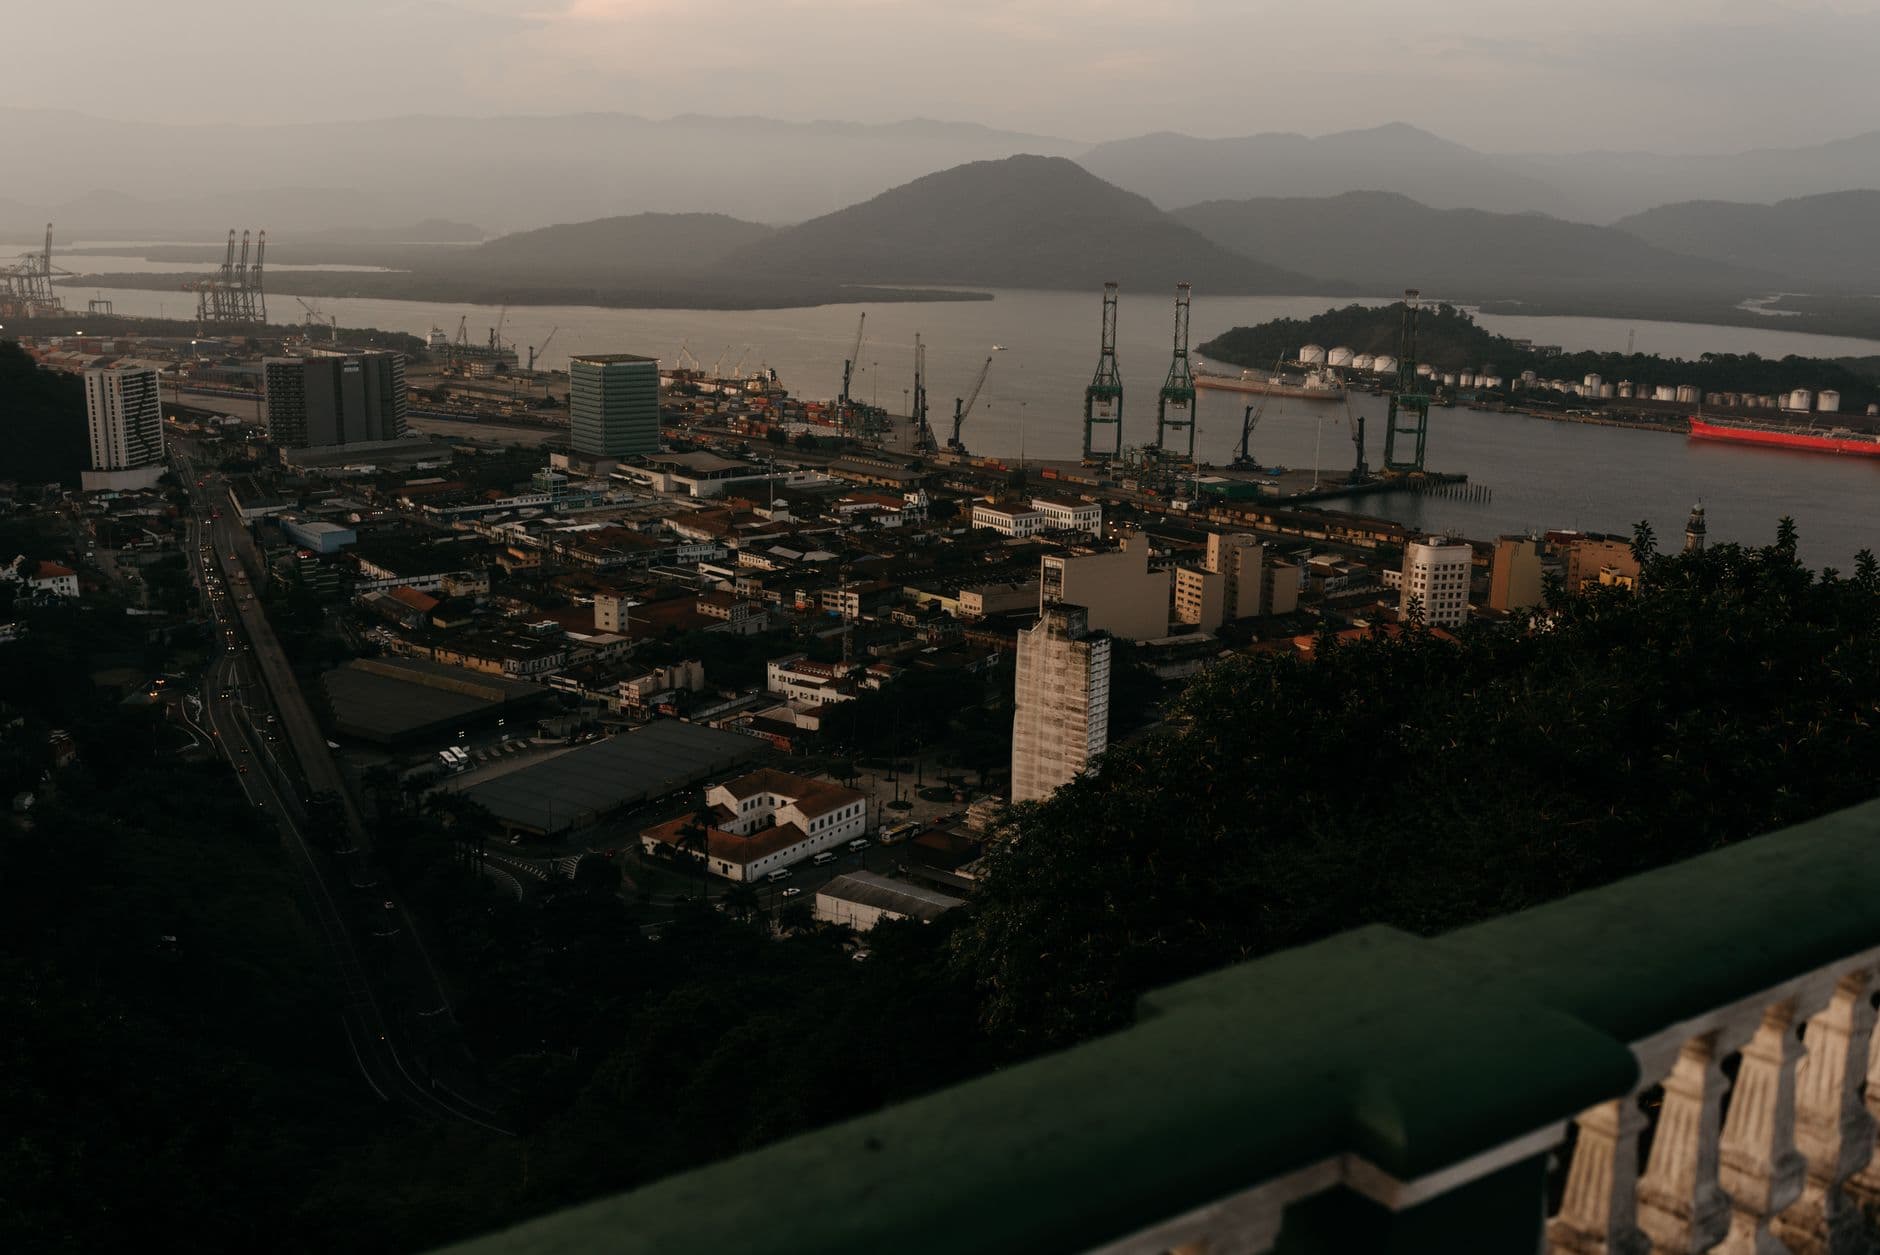

Santos in Brazil is the busiest container port in Latin America, handling 5,484,829 TEU, ahead of Manzanillo in Mexico on 3,924,501 and Cartagena in Colombia on 3,701,044. The ranking is straightforward. What it does not tell you is how much of that volume is cargo entering a market and how much is boxes changing ships, and for a shipper that difference decides which port is useful.
I book into this region regularly and the mistake I see most often is treating a high TEU number as a proxy for market access. A transshipment hub can be enormous and still be the wrong place to land your cargo, because nothing about its throughput says anything about the road and rail behind it.
The ranking by container volume
Figures below are 2024 throughput from CEPAL FAL Bulletin 414, the regional reference series.
| # | Port | Country | TEU | Primary role |
|---|---|---|---|---|
| 1 | Santos | Brazil | 5,484,829 | Gateway |
| 2 | Manzanillo | Mexico | 3,924,501 | Gateway |
| 3 | Bahía de Cartagena | Colombia | 3,701,044 | Gateway and transshipment |
| 4 | Callao | Peru | 3,074,530 | Gateway |
| 5 | Manzanillo International Terminal | Panama | 2,712,653 | Transshipment |
| n/a | Chancay | Peru | ~336,000 | New deepwater gateway |
Santos leads by 1.5 million TEU, which is a wider margin than any other gap in the table. Chancay is listed outside the ranking because its 2024 figure covers only the weeks after it opened in November, and it is the port most likely to change these positions.
Santos: agricultural export volume with a congestion problem
Santos handles Brazilian trade, and Brazilian trade is agricultural at a scale that shapes the whole port. The consequence for container shippers is seasonal: when the soy and sugar programmes peak, box operations compete with bulk for the same channel, berths and truck gates.
The growth has not stopped. Santos set a monthly record of 534,600 TEU in July 2025 and had moved 3.3 million TEU in the first seven months of that year, up 7.9 percent year on year. On the global table it climbed to 37th place in 2024 per Lloyd's List, which makes it the leading port of the southern hemisphere.
That is why I never quote a Santos lane without asking about the month. The port's throughput leadership is real and so is the queue, and we went through the mechanics of both in our piece on Santos congestion and the agri-export bottleneck.
Manzanillo: Mexico's Pacific gateway under nearshoring pressure
Manzanillo at 3,924,501 TEU is Mexico's main Pacific entry and takes the bulk of Asian imports feeding Mexican manufacturing. Nearshoring has added volume to a port whose landside access was already tight, and the results show up as dwell time rather than as a berth shortage.
The practical response is knowing the alternatives before you need them. Lázaro Cárdenas, Ensenada and the Gulf ports each take pressure off Manzanillo in different circumstances, and we mapped those options in our guide to routing around Manzanillo.
Cartagena and Panama: where the numbers stop meaning market access
Cartagena on 3,701,044 TEU and Panama's Manzanillo International Terminal on 2,712,653 both run substantial transshipment operations. A box counted at a transshipment hub is discharged from one vessel and loaded onto another, and it is counted twice in the process, once in and once out. It never clears customs there and never touches a truck.
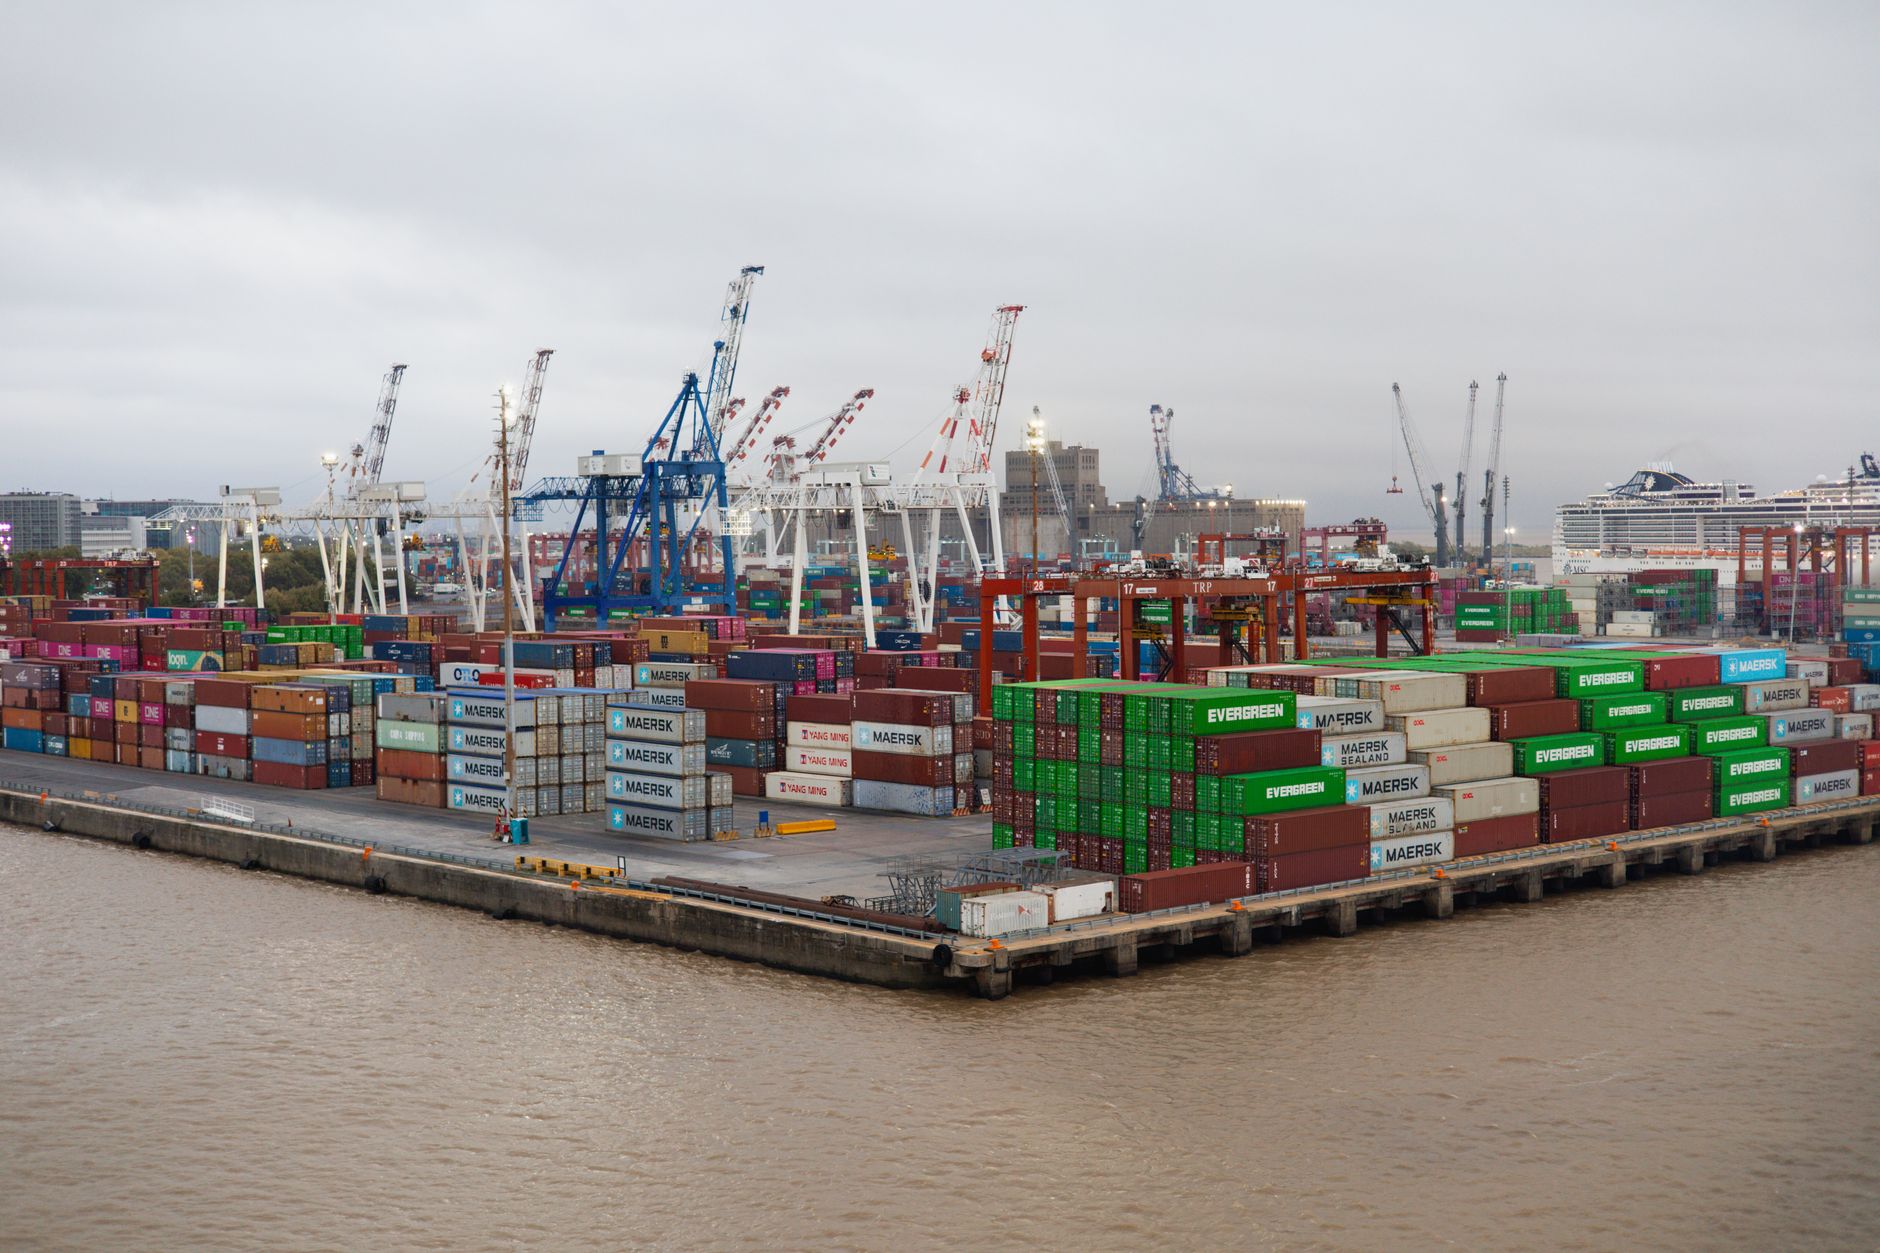
That has two consequences worth holding onto. Transshipment throughput overstates a hub's importance to any particular national market, and it understates its importance to your schedule, because a hub is where your connection either works or does not. If your box misses its onward vessel in Cartagena, the delay is a week even though the port did nothing wrong.
Panama complicates the table further because its container business is split across several terminals rather than reported as one port. MIT appears in the top five on its own, and the Panamanian system as a whole moves considerably more than the 2,712,653 TEU that gets it there. Any ranking that mixes ports, terminals and national systems in one column will mislead somewhere, and this is where it happens. For scale, MIT alone moved 229,721 TEU in a single month in early 2024, while the Panamanian national port system was growing at 10.3 percent year on year.
Peru: two ports, one coastline, different jobs
Callao at 3,074,530 TEU is Peru's established gateway and the fourth busiest in the region. Chancay, roughly 80 km up the coast, handled about 336,000 TEU in its opening weeks of 2024 and is projected to reach 3.5 million a year by 2032.
Callao is not standing still either. DP World's Bicentenario berth came into operation in 2024 and raised the terminal's capacity by about 80 percent, letting it work larger vessels. Chancay's designed capacity is 1.5 million TEU a year, so the 3.5 million projection for 2032 assumes expansion beyond what is built today.
Chancay was built deep and built for direct Asia calls, which is a different proposition from Callao's role as a national gateway. If the projection lands, Peru will hold two ports in the regional top five, and the routing question for anyone shipping to the west coast of South America changes from which carrier to which port. We looked at the reroute effect in detail in our analysis of the port of Chancay.
What the TEU column hides
Six things I check before choosing a Latin American port, none of which appear in a throughput ranking:
- Gateway or hub. Is the volume clearing into a market or connecting between vessels? Only the first tells you about inland access.
- Inland corridor quality. The road behind the port decides your total transit. In Brazil this is decisive, since only a small share of the national road network is paved.
- Seasonality. Agricultural export peaks change container performance at Santos and at several smaller Brazilian and Argentine ports.
- Direct service or relay. A port with fewer direct Asia or Europe calls means a relay leg, and relay legs add both days and risk.
- Customs throughput, not port throughput. Clearance timelines vary far more between these countries than berth productivity does.
- Depth for the ships you need. Direct calls by larger vessels require depth, which is precisely the gap Chancay was built to fill.
Where this table is heading
Three forces are pulling on the ranking at once. Nearshoring keeps adding volume to Mexican gateways. Chinese-funded deepwater capacity on the Pacific coast is creating direct Asia calls where there were relays. And Brazilian agricultural export growth keeps Santos ahead while making it harder to use in peak months.
None of that changes the order in 2026. Santos leads by a margin nobody closes quickly, and the honest summary is that the top four are gateways to four separate national markets rather than competitors for the same cargo. For the global picture these ports sit inside, our ranking of the busiest container ports in the world puts the regional numbers in scale: Santos ranks 37th worldwide, and no Latin American port enters the global top 30.
Frequently asked questions
What is the busiest port in Latin America?
Santos in Brazil, at 5,484,829 TEU in 2024 per CEPAL. It leads the second-placed port, Manzanillo in Mexico on 3,924,501 TEU, by more than 1.5 million TEU.
Which is the busiest port in South America specifically?
Santos, again, followed by Cartagena in Colombia on 3,701,044 TEU and Callao in Peru on 3,074,530 TEU. Mexico's Manzanillo is second regionally but sits in North America.
Does high TEU throughput mean a port is good for my cargo?
Not by itself. Transshipment hubs count each box twice, on discharge and on loading, and that cargo never clears locally. For market access, look at gateway volume and the inland corridor rather than the headline figure.
Will Chancay overtake Callao?
Not soon. Chancay handled roughly 336,000 TEU in its opening weeks against Callao's 3,074,530, and its designed capacity is 1.5 million TEU a year, with 3.5 million projected by 2032 on further expansion. Callao meanwhile added about 80 percent of capacity at DP World's Bicentenario berth in 2024. The nearer-term effect is more direct Asia calls to Peru rather than a change of national gateway.
Throughput figures are CEPAL FAL Bulletin 414 data for 2024, the most recent full-year regional series, and are reported per port or per terminal as the source records them, which is why Panamanian terminals appear individually. Chancay's figure covers a partial year from its November 2024 opening, and the 2032 projection is a developer forecast rather than committed volume.