


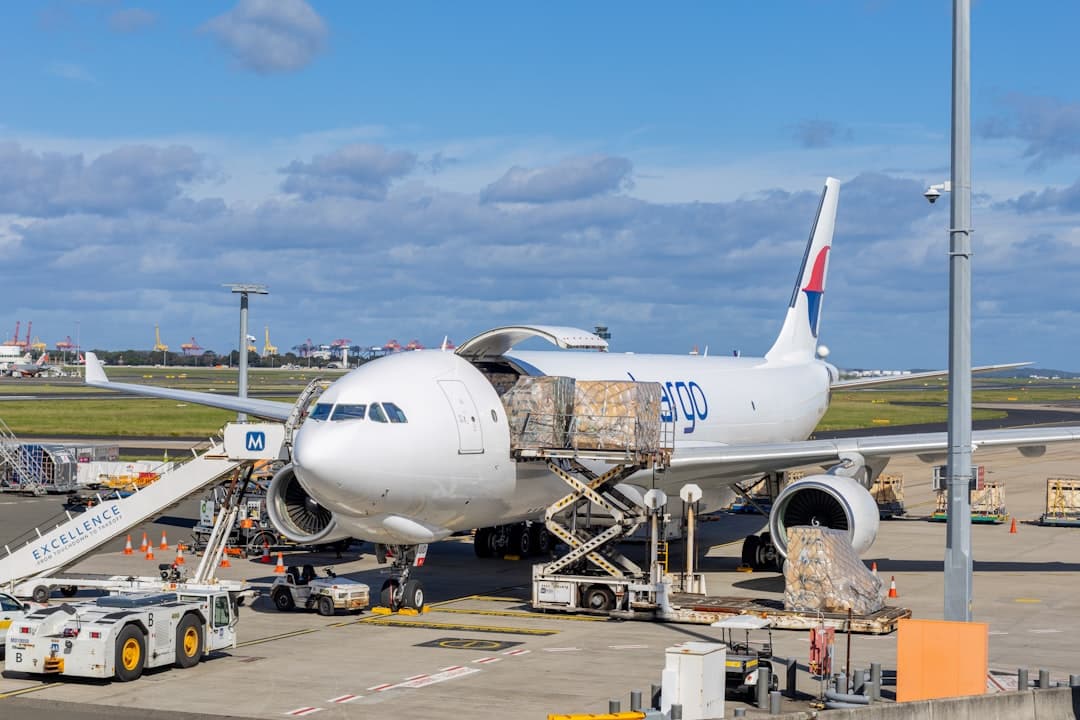

Three corridors carry roughly 60 percent of the world's air freight by tonnage: Asia to North America, Asia to Europe, and the transatlantic run between Europe and North America. That concentration has been stable for years. What is not stable is which direction on those lanes is worth flying, and in July 2026 one regulatory change took close to a quarter of the volume off a single lane in under a month.
A lane is directional. An airport is not. That distinction sounds academic until you are quoting a customer both ways and discover that the return leg prices at a third of the outbound, because the aircraft has to go back whether it is full or not. I have booked plenty of capacity that existed only because someone else paid for the flight in the other direction.
The busiest air cargo trade lanes in 2026, ranked
| # | Lane | Type | Where it stood in late July 2026 |
|---|---|---|---|
| 1 | Asia Pacific to North America | Headhaul | Supported by tariff frontloading into the 24 July deadline; North America the only region up over two weeks, at plus 2 percent |
| 2 | Asia Pacific to Europe | Headhaul | Down 15 percent year on year in week 28; Hong Kong to Europe down 23 percent year on year by week 30 |
| 3 | Europe to North America | Transatlantic | European outbound tonnage down 2 percent week on week, rates up 1 percent |
| 4 | Middle East and South Asia to Europe and the US | Mixed | Dubai to the USA and Dubai to Europe both down 14 percent week on week |
| 5 | Intra Asia Pacific | Regional | Down 7 percent week on week; Japanese exports down 17 percent |
| 6 | Africa outbound | Thin, seasonal | Tonnage down 7 percent week on week while rates rose 5 percent |
Worldwide chargeable weight fell 3 percent week on week in week 30, capacity fell 1 percent, and the global average rate held at 3.02 dollars per kilo against 3.01 the week before. For the whole of 2025 the global average sat at 2.47 dollars per kilo on tonnage roughly 4 percent above 2024, which tells you how much of the current price level is recent.
A lane is not an airport, and Anchorage proves it
Anchorage ranks third in the world by cargo tonnage handled, behind Hong Kong at about 5.07 million tonnes and Shanghai Pudong. Almost none of that freight has any interest in Alaska. It is a fuel and crew stop on the Asia to North America lane, and the tonnage is counted twice in a sense, once landing and once departing, without a shipper anywhere paying for an Anchorage service.
This is why I never plan from an airport ranking. Our ranking of the busiest cargo airports answers the question of where the infrastructure sits. It does not tell you where the demand is, and the two diverge most exactly where the network is densest. Louisville sits fourth on the airport table because UPS built a sorting operation there, not because Kentucky exports.
Direction sets the price, not distance
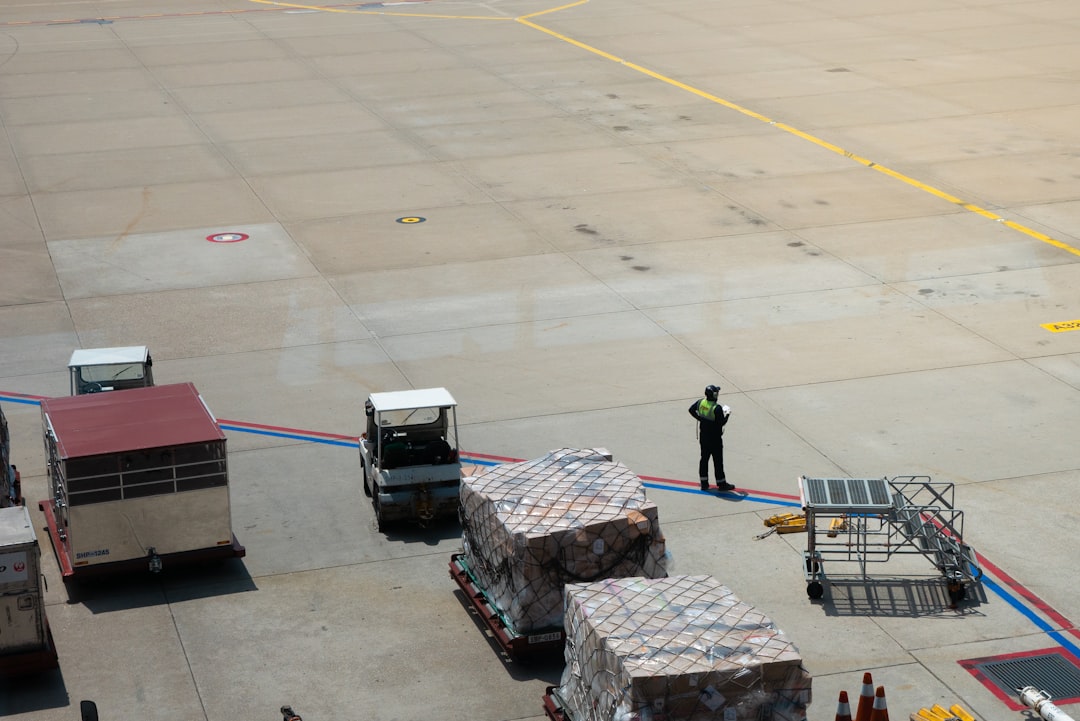
On a mature lane the outbound and return legs are different markets with different customers. Manufacturing exports move east to west out of Asia and pharmaceuticals, machinery parts and perishables come back in far smaller volumes. The airline still has to reposition the aircraft, so backhaul capacity gets sold at whatever it will fetch.
The week 30 figures show the pattern cleanly. Africa lost 7 percent of tonnage and gained 5 percent on rate in the same week, which happens when thin volumes concentrate onto fewer flights. Central and South America lost 1 percent of tonnage and 4 percent on rate, the opposite signal, meaning capacity stayed while demand slipped. Two regions, two directions of travel on the same week's data.
- Book headhaul early and backhaul late. The outbound leg firms up as the flight fills, while the return leg softens right up to departure.
- Watch the fuel line separately. Jet fuel averaged 160.06 dollars a barrel on 24 July 2026, and rising fuel puts a floor under rates even when volume is falling.
- Treat a lane's rate as a weekly number. Hong Kong to Europe fell for five consecutive weeks through July before stabilising.
What the first of July rewrote
The European Union removed its 150 euro duty-free threshold on 1 July 2026 and introduced a handling charge of 3 euros per item on low-value consignments. The effect on the Asia to Europe lane was immediate and larger than most forecasts. Hong Kong to Europe chargeable weight fell 5 percent in week 29, the fifth consecutive weekly decline, leaving volumes almost 25 percent below the equivalent week of 2025. By week 30 the year-on-year gap was 23 percent. Mainland China outbound widened its annual decline from 8 to 10 percent.
What moved was e-commerce, which had been the growth engine of that lane for four years. When the duty advantage on a 40 euro parcel disappears, the economics of flying it stop working before the demand for the product does, and the volume migrates to ocean and to consolidated customs models. We covered the compliance mechanics of this in our guide to the EU low-value import rules and the 3 euro parcel duty, and the lane data is what that policy looks like from the ramp.
The transpacific pull in the other direction
While Asia to Europe was shedding volume, Asia to North America was absorbing it. Tariff deadlines pull freight forward, and the 24 July date produced the familiar pattern of shippers paying air rates to beat a duty change that would cost more than the freight. North America was the only region to post a gain over the two-week comparison, at plus 2 percent, against declines everywhere else.
Frontloading is borrowed volume. Every kilo flown to beat a deadline is a kilo that does not fly the following month, and the lane usually gives back more than it took because inventory arrives before demand does. If you are budgeting the transpacific for the fourth quarter, the July numbers are the wrong baseline.
One structural change sits underneath the tariff noise and will outlast it. Semiconductor and AI hardware shipments have become a growth engine on the transpacific in their own right, and that freight behaves nothing like e-commerce: high value per kilo, tightly scheduled, indifferent to a rate move of 20 cents. As the parcel volume that built the Asia to Europe lane migrates to ocean, the lane that keeps its yield will be the one carrying the equipment rather than the consumer goods. Effective capacity is also tighter than the schedule implies, because the Middle East conflict continues to force routings around closed airspace and absorbs block hours that never appear as a cancellation.
How this connects to our other air freight rankings
Lanes are flown by carriers, so read this beside our ranking of the largest air cargo airlines, where the tonne-kilometre leaders are the ones setting capacity on the corridors above. The aircraft themselves impose their own limits, which is the argument in our ranking of the biggest cargo planes: a lane with no main-deck loader at one end cannot take certain cargo whatever the rate. For rate strategy and capacity planning rather than lane structure, our air freight planning playbook for 2026 goes deeper on the buying side.
Frequently asked questions
What is the busiest air cargo lane in the world?
Asia Pacific to North America by volume, followed by Asia Pacific to Europe and then the transatlantic between Europe and North America. Those three corridors together carry around 60 percent of global air freight tonnage, and the ordering has been stable even while individual lanes swing by double digits year on year.
Why did Hong Kong to Europe volumes collapse in July 2026?
The European Union removed the 150 euro duty-free threshold on 1 July 2026 and added a 3 euro per item charge on low-value parcels. E-commerce shipments that depended on that exemption stopped flying, and chargeable weight on the lane fell for five straight weeks to sit around 23 to 25 percent below the same period of 2025.
What is the average air freight rate in 2026?
The global average was 3.02 dollars per kilo in the last week of July 2026, against a full-year 2025 average near 2.47 dollars. Lane averages diverge widely from that figure, and the direction you are flying matters more to your quote than the global number does.
Why is backhaul cheaper than headhaul?
Because the aircraft returns regardless. Once a carrier has committed the rotation, any revenue on the light leg beats flying empty, so backhaul is priced against marginal cost rather than against the cost of the flight. This is also why backhaul capacity vanishes first when a carrier cancels a rotation.
Does an airport ranking tell me where to route cargo?
Only partially. Anchorage sits third worldwide by tonnage while serving as a technical stop rather than a market, and integrator hubs like Louisville rank high because of sorting operations rather than local demand. Route from the lane and its available capacity, then choose the gateway.
Weekly tonnage and rate figures come from market data covering a large sample of airline and forwarder transactions and are revised as data lands, so week-on-week percentages should be read as direction rather than precision. Lane ordering by volume follows industry corridor analyses, which differ in how they treat transhipment and intra-regional traffic. Airport tonnage is as reported by the airport operators. Rates quoted are global or lane averages including surcharges and will not match a specific quotation. Tariff and threshold rules cited were in force at the start of August 2026 and are moving quickly: confirm the current position before you price a shipment.