


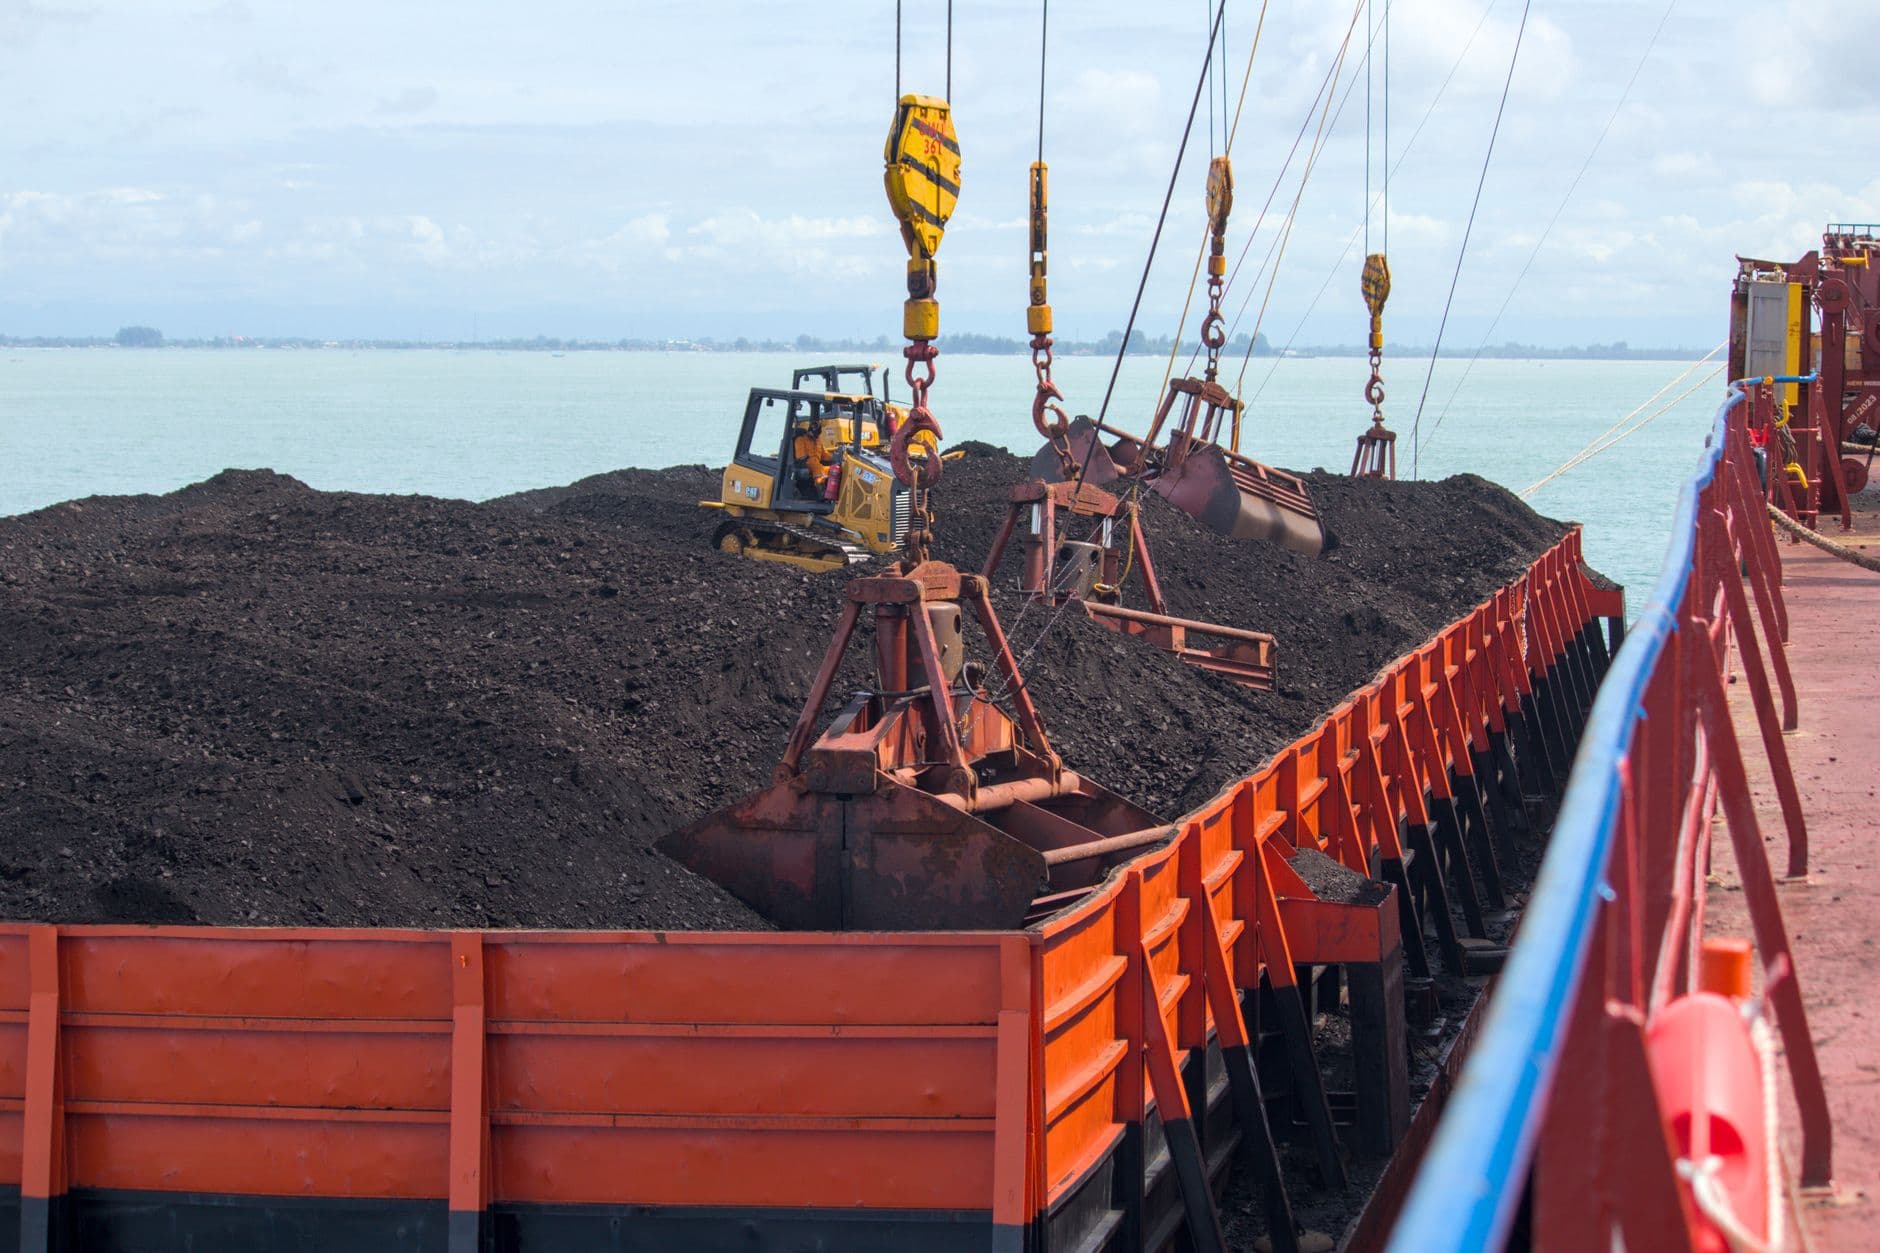

Ask ten people in shipping to name the largest dry bulk company and you will get four answers, all defensible. That is not because anyone is wrong. It is because dry bulk has no single scoreboard, and the four common ways of measuring size put different companies on top. I spent a while this month reconciling published fleet figures for a client comparing carriers, and the exercise is worth walking through, because the measurement question turns out to be more useful than the ranking itself.
Here is what the numbers support, where they conflict, and what a cargo owner should actually take from it.
Four ways to measure, four different winners
Before any table, the definitions, because this is where online rankings quietly mislead.
Deadweight tonnage (DWT) measures how much weight a vessel can carry, including cargo, fuel, stores and crew. Sum it across a fleet and you get carrying capacity. This is the fairest single measure of a dry bulk fleet's size, and it is the one I default to.
Vessel count is the number everyone quotes and the least informative. A fleet of 163 mid-size ships and a fleet of 89 very large ones can carry nearly identical tonnage, as you will see below.
Owned versus operated is the distinction that breaks most comparisons. Some companies own their hulls. Others build enormous operated fleets through time charters, controlling far more tonnage than they own. Both are real businesses; they just are not the same number.
Market share of global capacity puts everything on a common denominator, and it delivers the most sobering fact about this sector, which I will come to.
The largest fleets by deadweight
With those caveats stated, here is what industry fleet trackers report for the leading owners. I am attributing these as reported figures rather than presenting them as audited, because dry bulk operators publish on inconsistent bases and the trackers reconcile them differently.
| Company | Vessels | Reported deadweight | Note |
|---|---|---|---|
| Star Bulk Carriers | 163 | About 15.6 million DWT | Largest listed operator after the Eagle Bulk merger |
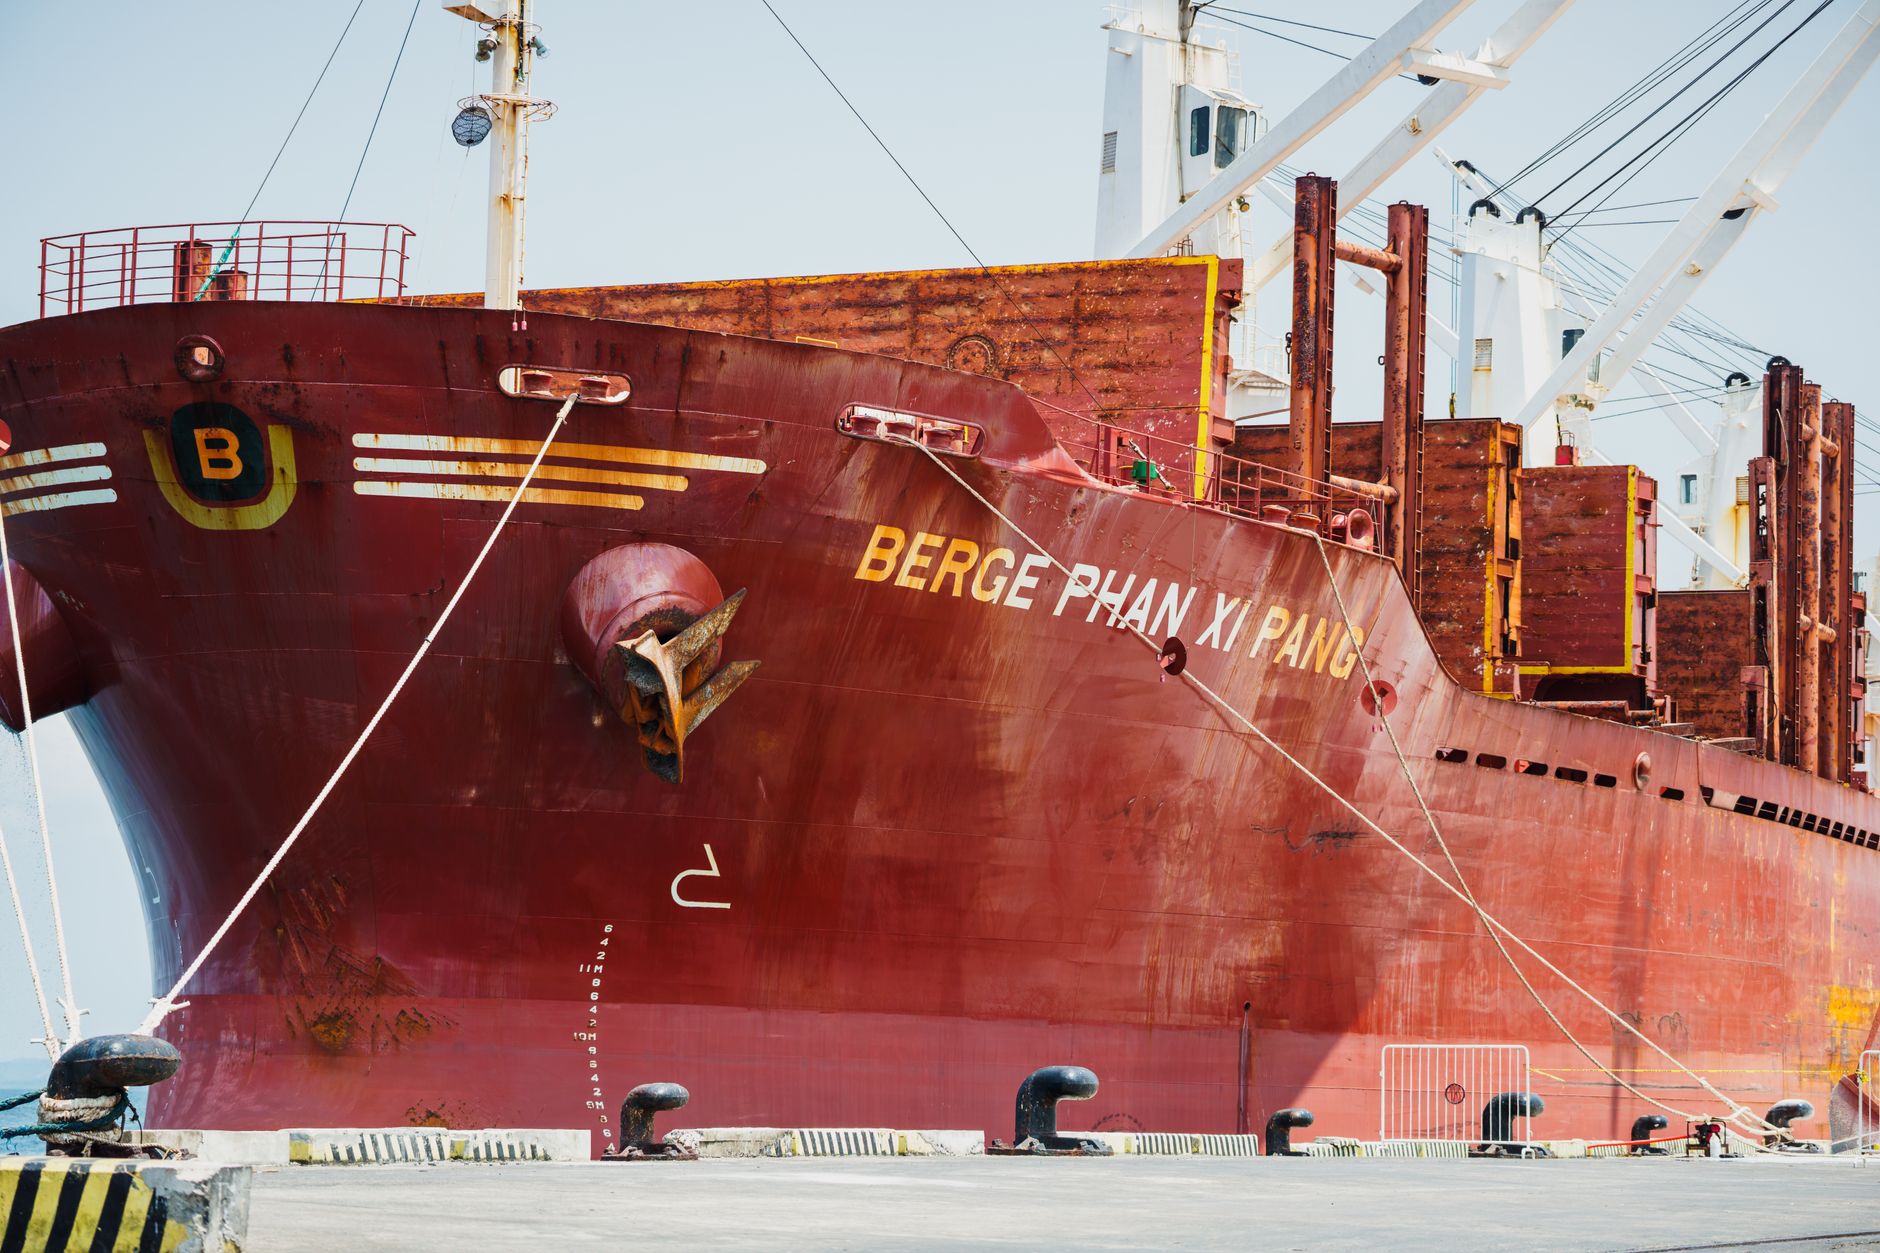
| Berge Bulk | 89 | About 15.0 million DWT | Leading independent owner; very large ship bias |
| Golden Ocean Group | More than 90 bulkers | About 13.7 million DWT (bulk fleet) | Merged with CMB.Tech July 2026; group exceeds 250 ships |
| Navios Group | 179 (total fleet) | Not comparable (mixed fleet) | Group total spans more than dry bulk |
| Oldendorff Carriers | About 76 owned, roughly 750 operated | Not published on a comparable basis | Scale comes largely from chartered-in tonnage |
Look at the first two rows together, because they make the measurement point better than any explanation. Star Bulk is reported at roughly 15.6 million DWT across 163 vessels after absorbing Eagle Bulk. Berge Bulk sits close behind at about 15.0 million DWT across 89 ships. Nearly comparable carrying capacity, with 74 more hulls in one fleet than the other. Rank by vessel count and Star Bulk wins comfortably. Rank by average ship size and Berge Bulk is in a different business, because its tonnage rides on far fewer, far larger vessels. Company fleet reports, July 2026
Consolidation is what moved this table. Star Bulk's merger with Eagle Bulk created the largest listed dry bulk operator, and Golden Ocean closed its combination with CMB.Tech in July 2026, producing a group of more than 250 ships across segments while its bulk fleet sits above 90 vessels and roughly 13.7 million DWT. Navios reports 179 ships across a mixed group, which is why its headline count cannot be compared directly against a pure bulk owner's tonnage. Golden Ocean Navios
Oldendorff Carriers belongs on any serious list and resists this table entirely. It owns something like 76 vessels while operating in the region of 750 through charters. Oldendorff Carriers Any ranking built purely on registered ownership understates it by an order of magnitude, and no table I can build will fix that.
The number that reframes the sector
Star Bulk frames its position as roughly 6.8% of global fleet capacity. Star Bulk Sit with that number, because it belongs to the largest listed operator in the business. In container shipping, the top ten lines control the overwhelming majority of capacity and coordinate through alliances. In dry bulk, a company with 163 ships holds under 7% of the market.
Dry bulk is genuinely fragmented. There are no alliances, no vessel-sharing agreements of the container kind, and thousands of owners from single-ship companies to the names above. That structure explains almost everything else about how the sector behaves, including why rates are so volatile: nobody has enough share to manage supply, so freight prices clear on spot demand.
The contrast with the container trades is stark, and I have written about that side in the biggest container ships and shipping lines guide. If you move both cargo types, do not carry your container procurement instincts into a bulk negotiation. The market structures are not comparable.
The size classes, and why the class matters more than the owner
Dry bulk vessels sort into classes defined mostly by what infrastructure they can physically use. Approximate ranges:
- Capesize, around 180,000 DWT and up. Too large for the Panama Canal historically, hence the name: these ships route around the Cape of Good Hope or Cape Horn. They dominate iron ore and long-haul coal.
- Panamax, roughly 65,000 to 80,000 DWT, sized to transit the Panama Canal locks. Coal and grain.
- Supramax and Ultramax, roughly 50,000 to 65,000 DWT, usually fitted with their own cranes, which lets them work ports without shoreside equipment.
- Handysize, around 15,000 to 35,000 DWT. The workhorses for smaller ports and minor bulks.
For a cargo owner the class is the operative question, not the brand on the funnel. Your parcel size, your load port's draft and whether the discharge berth has cranes will determine the class, and the class narrows the owner list for you. I have watched procurement teams shortlist carriers by name and then discover that half of them do not operate the class the trade requires.
Gear matters more than people expect. A Supramax with cranes can serve a berth that a gearless Panamax cannot touch, and in emerging-market ports that capability is worth more than a small rate difference.
What actually moves the rates
Three demand blocks drive this market: iron ore, coal and grain. Iron ore into China sets the tone for Capesize earnings, coal moves on both energy demand and policy, and grain runs on harvest cycles and trade politics. Baltic Exchange
Because the fleet is fragmented and supply cannot be managed, small demand shifts produce large rate moves. That is the defining feature to plan around. A cargo owner who treats bulk freight as a stable cost line will be wrong in both directions within a year, and the volatility is structural rather than a temporary condition anyone will fix.
Voyage distance is the other lever, and it is underappreciated. Ton-miles, not tons, determine how much of the fleet is absorbed. A rerouting that lengthens voyages tightens the market without any change in cargo volume, which is exactly what canal disruption does.
Chokepoints hit bulk harder than boxes
Panamax exists as a class because of one waterway, which tells you how much canal access shapes this sector. When transit capacity at Panama tightens, Panamax operators reroute or wait, and the ton-mile effect ripples into rates for classes that never intended to transit.
Booking mechanics at Panama have changed in ways that matter for bulk operators specifically, since bulk carriers rarely have the slot priority that container lines secure. I cover the current system in the Panama Canal booking window guide, and the wider picture across the major waterways is in the biggest and busiest canals ranking.
Capesize ships sidestep the canal question by design and pay for it in distance. That trade-off, more steel for more sea miles, is the oldest calculation in bulk shipping and it has not changed.
What a cargo owner should take from all this
- Rank by deadweight, not vessel count, when you are assessing whether a carrier has the capacity you need.
- Ask whether a quoted fleet is owned or operated. Both can serve you; the difference tells you how the company will behave when the charter market turns.
- Start from the vessel class your trade requires, then shortlist owners who operate it. Draft, parcel size and shoreside cranes decide this before any commercial discussion.
- Assume rate volatility rather than hedging against it with a single fixed assumption. Under 7% market share for a major owner means nobody is stabilizing this market.
- Model ton-miles, not tons, when a routing change is on the table. Longer voyages tighten capacity even at flat volumes.
- Check canal exposure by class. A Panamax-dependent trade carries a specific risk that a Capesize trade does not.
The honest conclusion on the ranking question: Star Bulk leads the listed owners at roughly 15.6 million DWT across 163 ships after the Eagle Bulk merger, Berge Bulk sits just behind at about 15.0 million DWT with only 89 hulls, Golden Ocean's bulk fleet runs near 13.7 million DWT inside a much larger post-merger group, and Oldendorff's operated scale of roughly 750 vessels escapes ownership-based tables altogether. But the fact worth remembering is not the order, and the order will move again with the next merger. It is that the largest name in dry bulk still controls under 7% of the fleet, which is why this market prices the way it does and why your class and your route will tell you more about your freight cost than any carrier's position on a list.